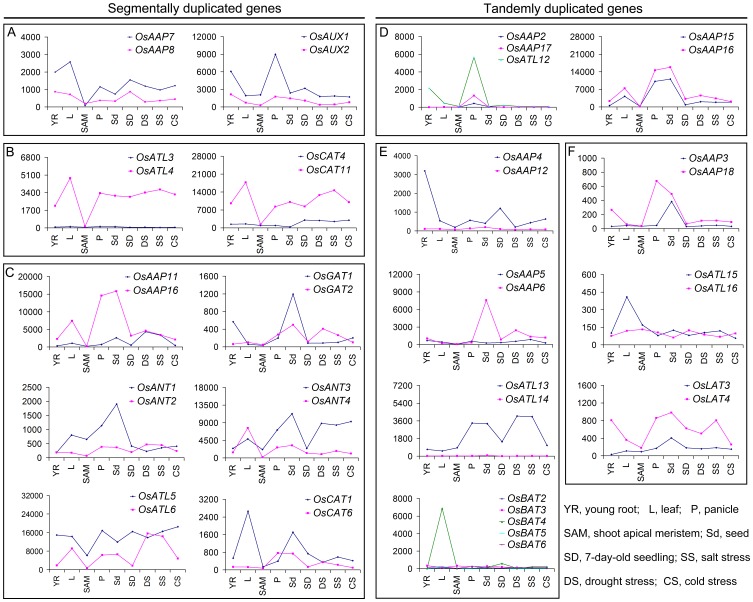
Figure 8. Expression divergence of paralogous OsAAT genes involved in duplication.
The absolute values of duplicated genes obtained from microarray data were compared in various organs under abiotic stresses. X-axis indicates representative samples and Y-axis is scales of expression level. The segmentally and tandemly duplicated genes are shown on the left and the right, respectively. (A) and (D) Showing gene pairs that are retention of expression; (B) and (E) showing gene pairs described as non-functionalization; (C) and (F) showing gene pairs described as neo-functionalization.

