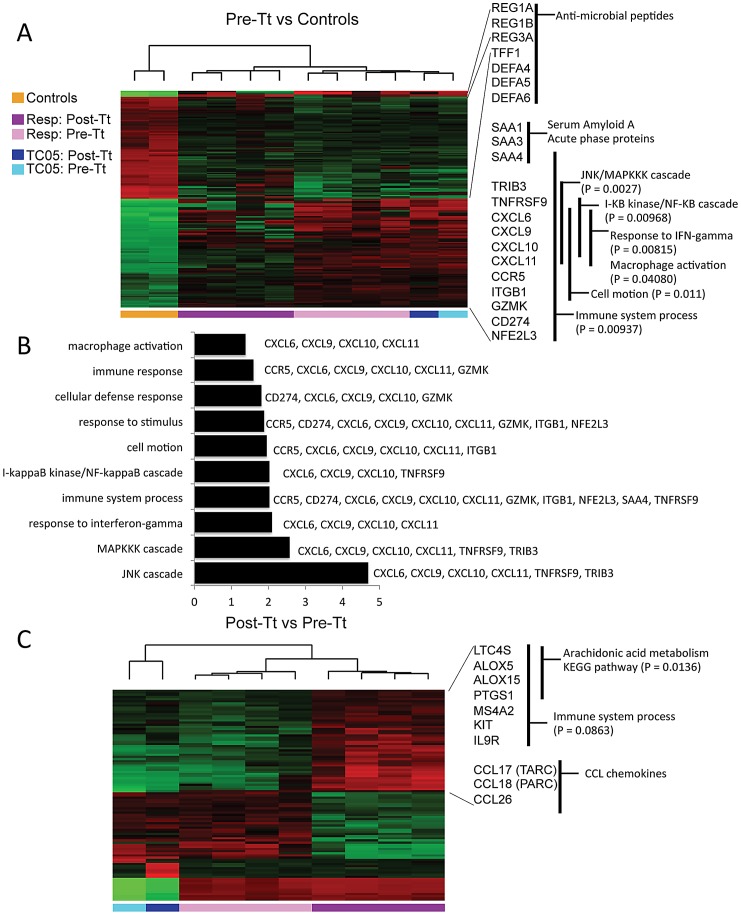
Figure 3. Transcriptional profiling of colon biopsies by macaque whole genome oligonucleotide microarrays.
RNA was isolated from pinch biopsies collected during colonoscopies for microarray analysis. Hierarchical clustering analysis of samples and genes based on the expression levels of genes differentially expressed (B>0) between (A) pre-treatment colitis samples and healthy controls, where each column represents an individual subject and each row represents a single gene. Black indicates median levels of expression; red, greater than median expression; green, less than median expression. Colored horizontal bars indicate the clustering of samples collected from healthy controls (Controls, orange), clinical responders [pre-treatment (Resp: Pre-Tt, light purple) and post-treatment (Resp: Post-Tt, dark purple)], and subject TC05 [pre-treatment (TC05: Pre-Tt, light blue) and post-treatment (TC05: Post-Tt, dark blue)]. Representative genes are listed in the biological processes that are overrepresented. (B) GO analyses identified biological processes up-regulated in pre-treatment colitis samples. X axis indicates the amount of statistical significance [as −log(P)] in enrichment for the indicated biological process, with the up-regulated genes in this process listed. (C) Hierarchical clustering analysis of samples and genes based on the expression levels of genes differentially expressed (B>0) between colitis samples before and after T. trichiura treatment. The complete list of genes for (A) is shown in Figure S2 and Table S1. The complete list of genes for (C) is shown in Figure S3 and Table S2.

