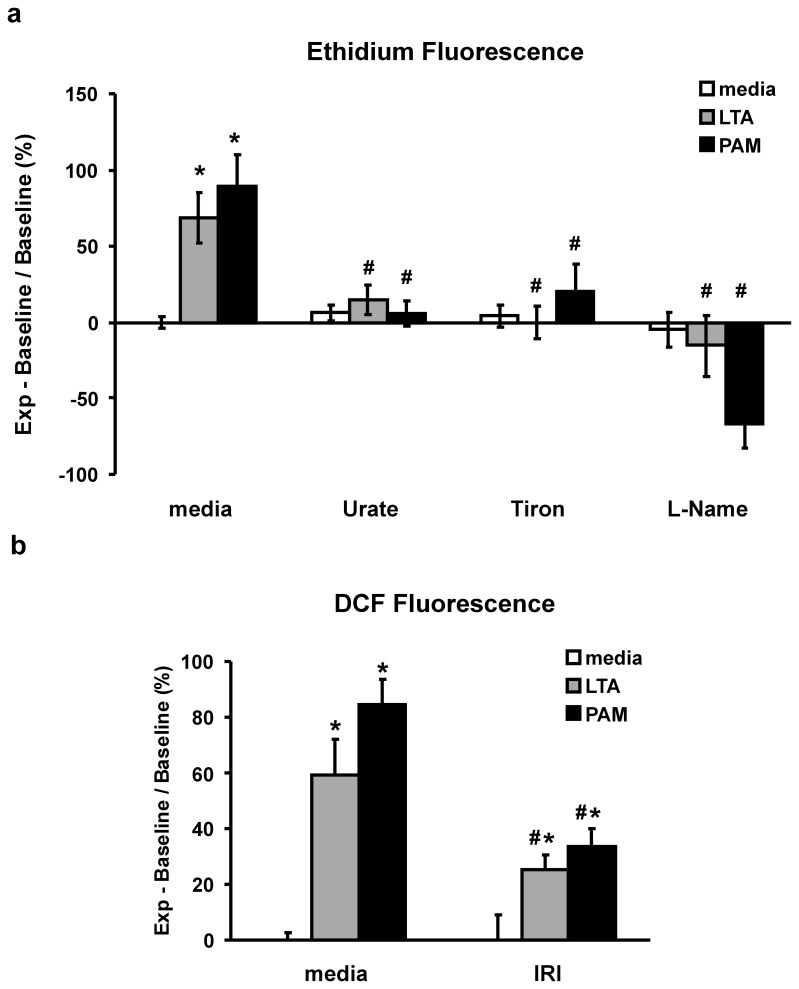
Figure 4. TLR2 agonist-induced production of reactive oxygen/nitrogen species (RONS).
(a) Fluorescence of oxidized dihydroethidium (DHE) in cell sonicate after a 30 minute treatment of PMEM with LTA (30 µg/mL) or PAM (10 µg/mL) alone or co-treated with RNS scavenger, Urate (5 µM), ROS scavenger, Tiron (5 mM), or NOS inhibitor, L-NAME (100 µM). (b) Fluorescence of oxidized DCFDA in intact cell monolayers in 96-well plate following a 2 hour treatment with LTA or PAM alone (both 10 µg/mL) or co-treatment following a 2 hour pretreatment with IRAK1/4 inhibitor, (IRI: 10 µM). Units are % change in relative fluorescence units from Control values (media alone). Values represent means ± SEM (N ≥4). * p<0.01 vs. media alone, # p<0.04 vs. TLR2 agonist alone.

