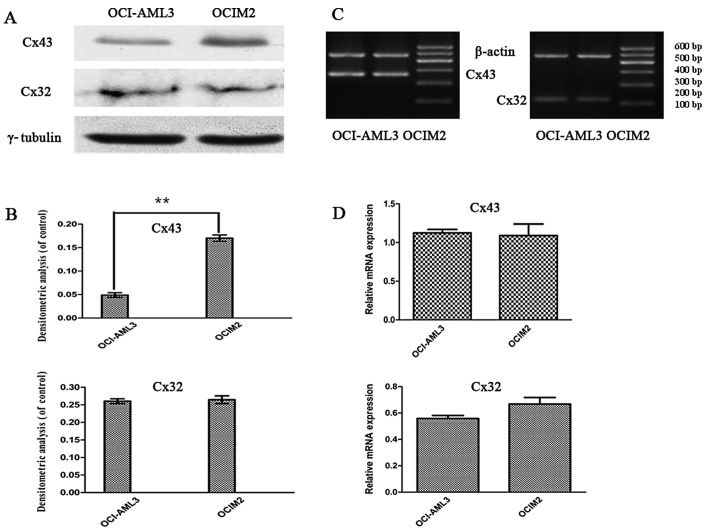
Figure 3.
The expression of Cx43 and Cx32 mRNA and protein in OCI-AML3 and OCIM2. (A) The OCI-AML3 and OCIM2 cells were harvested and the protein level of Cx43 and Cx32 was determined by western blot assay. (B) The values for Cx43 and Cx32 were corrected relative to γ-tubulin and are shown in the histogram. (C) The OCI-AML3 and OCIM2 cells were harvested and the mRNA levels of Cx43 and Cx32 were determined by RT-PCR. β-actin was used as an equal loading control. (D) The bands were quantified by densitometric analysis and are shown in the histogram. Statistical significance was determined by the Student’s t-test. The data is represented as the mean ± SD from three independent experiments. **P<0.01.

