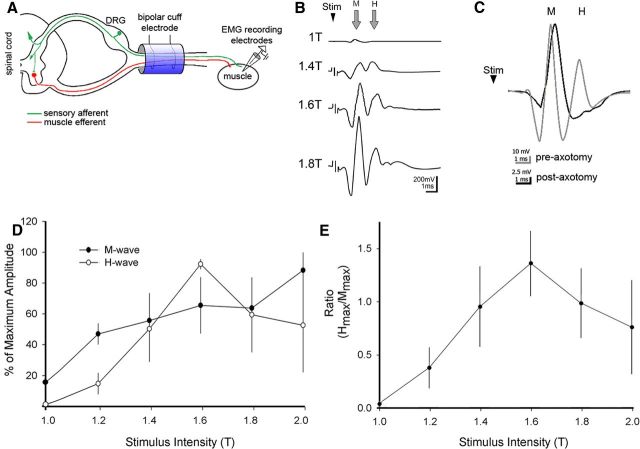
Figure 7.
Physiological assessment of monosynaptic H-reflex. A shows the experimental setup for terminal electrophysiological testing. A stimulation bipolar cuff electrode was mounted around the deep radial nerve in the forelimb and stimulus-evoked EMGs were recorded with electrodes inserted into the extensor carpi radialis. Shown is the H-reflex monosynaptic pathway with sensory afferents (green) and motor efferents (red). Shown are the M-response (direct muscle activation) and H-reflex (central loop) after cuff stimulation. B, Averages (n = 15) of a representative recording from the DRN in a sham showing the responses to threshold stimulation (1T) and three suprathreshold stimuli. Note that the M-wave becomes progressively larger with increasing current, whereas the H-wave peaks at 1.6T. C, Representative M- and H-waves before (gray) and after (black) cutting the radial nerve proximal to the cuff electrode. Note loss of the H- but not the M-wave after nerve section demonstrating two distinct stimulus-evoked wave responses. D, The H- and M-wave percentage of maximal amplitudes are dependent on the stimulus intensity (T, threshold or rheobase for the M-wave response in each animal). As observed previously (Ho and Waite, 2002), whereas the amplitude of the M-wave increases over the range of stimulus intensities, the H-wave amplitude initially increases, reaches maximal values near 1.6T, and then progressively decreases. E, The ratio of the maximum amplitudes of the H-wave (Hmax) and M-wave (Mmax) reveals the stimulus-dependent relationship between the responses of these two waveforms.

