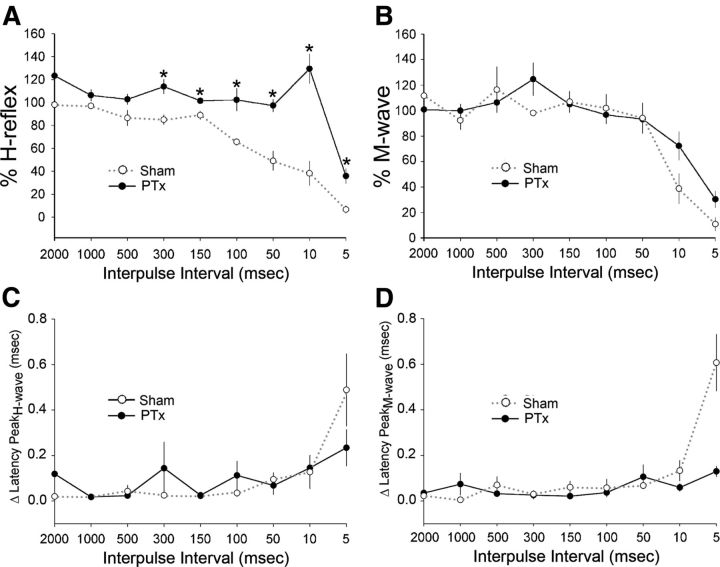
Figure 9.
Rate-dependent depression of the H- and M-responses. Percentage H-reflex (A) and percentage M-wave (B) amplitudes (y-axis in A and B) are normalized values of the stimulus-evoked responses of the test pulse compared with the control pulse. In sham animals, as the interpulse intervals between the control and test pulse decreased (i.e., increase in stimulus frequency), both the percentage H-reflex (black line) and percentage M-wave (red line) remained relatively stable, close to 100%; at shorter intervals, these values decreased, demonstrating a rate-dependent depression of the responses. In PTx animals on the contralesional side, the percentage H-reflex exhibits less depression at higher rates of activity compared with sham, demonstrating increased excitability of the H-reflex; at 10 ms, there is evidence of strong facilitation (*p < 0.05). In contrast, the percentage M-wave does not significantly change after PTx. C and D plot the change in latency between the test and conditioning responses in relation to IPIs. Latency remained stable between IPIs of 2000 and 50 ms.

