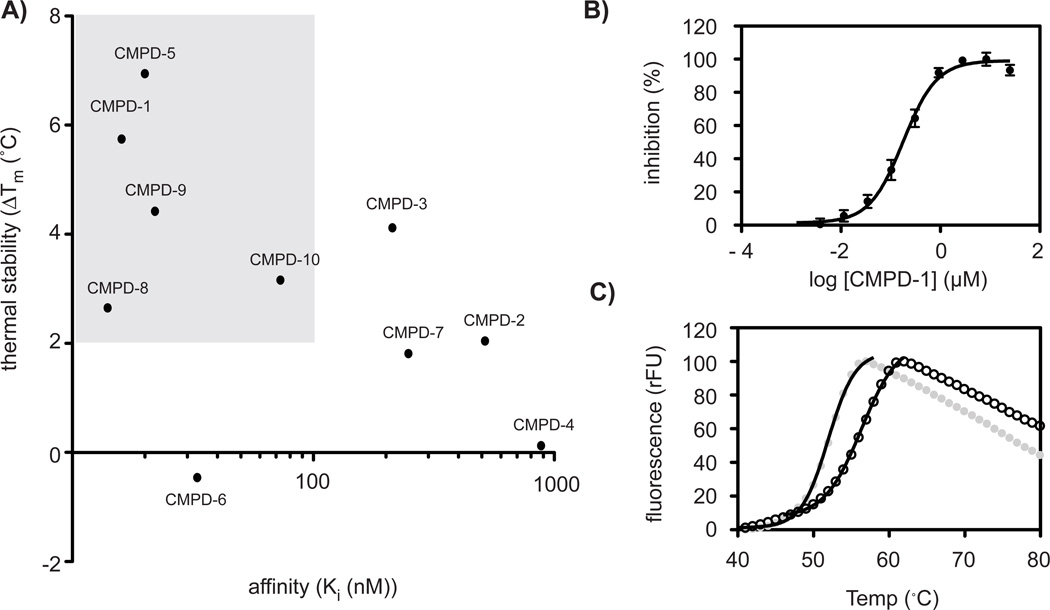
Figure 3.
Biochemical characterization of 10 compounds selected by fluorescence polarization and differential scanning fluorometry assays. (A) Correlation of DSF-based thermal stability versus FP-based Ki values of re-synthesized compounds. Only compounds with a Δ Tm ≥ 2 °C and a Ki ≤ 100 nM were selected for further evaluation. (B) Binding curve of compound 1 with NC’ in FP-based displacement experiment reveals a high affinity (Ki = 18 ± 14 nM). Shown is the mean ± s.d. of a representative experiment from 3 experiments. (C) DSF-based stability analysis of the compound 1 – Gag’ complex. Compound 1 enhances the stability of Gag’ by Δ Tm = 5.7 ± 1.0 °C (grey circles = control; black open circles = Gag’ + compound 1; nonlinear fit = black line).

