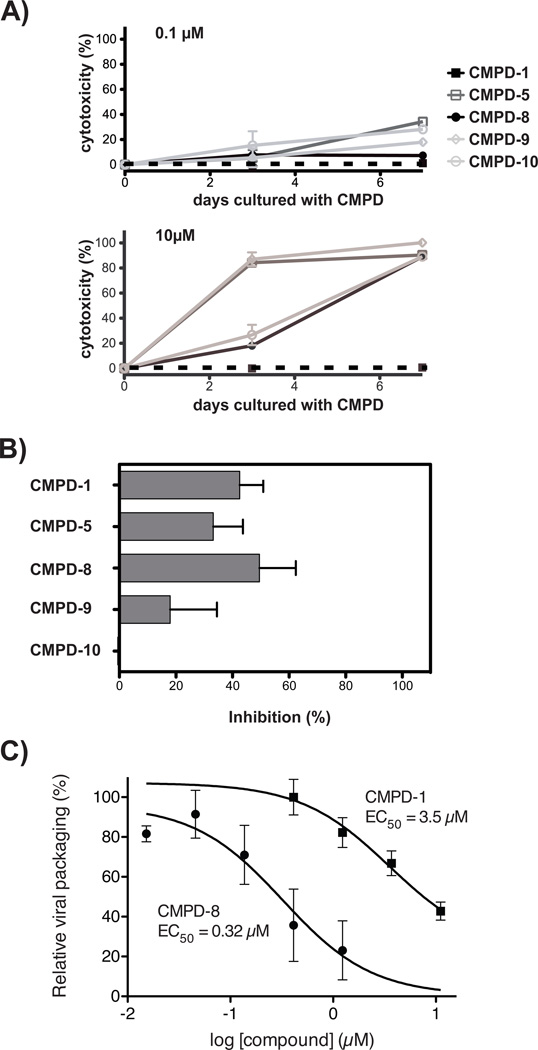
Figure 5.
Cellular toxicity and anti-HIV-1 evaluation of 5 selected compounds. (A) Cellular toxicity evaluation of compounds 1, 5, 8, 9, or 10. Cellular viability over time of SupT1 T-cells was evaluated in the presence of 0.1 or 10 µM of each of the 5 compounds using a fluorescence-based cytotoxicity assay. No compound control cultures contained 0.2 % DMSO, the diluent for the compounds, for comparison. (B) Inhibition of HIVLAI replication in primary CD4+ T cells. Cells were cultured with 0.2 µM compounds 1, 5, 8, 9, or 10 for 3 days before exposure to 100 ng p24 of HIVLAI. 9 days after HIV-1 exposure, cells were evaluated for infection by flow cytometry to determine cellular viral p24 and results were plotted as mean ± s.d. of % inhibition. 0.2 µM Amprenavir, a protease inhibitor, was used at 5-fold over EC50 as a known inhibitor of viral replication and was found to inhibit viral replication 98 % (data not shown). All assays were in triplicate and shown is 1 of 2 replicate experiments. (C) Compounds 1 and 8 disrupts HIV-1 production. The EC50s of compounds 1 and 8 were determined utilizing a HeLa cell line transiently transfected with plasmid HIVNL4-3 DNA in the absence or presence of increasing concentrations of each compound. HeLa cell culture controls contained 1% DMSO (v/v), the diluent used for the compounds. Viral production was determined by measuring p24 production. Results are shown as relative viral packaging in the presence of compounds as compared to DMSO controls. All points are the result of three independent transient transfections and results are shown as the mean ± s.d. of relative viral packaging. EC50s values were determined using non-linear regression analysis in Prism 5.0d to fit a three-parameter dose-response curve to normalized p24 values.

