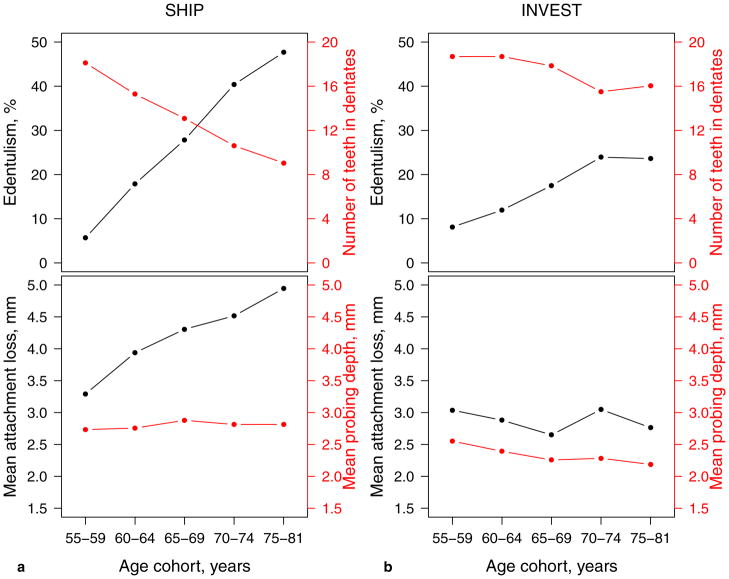
Figure 2.
For SHIP (a) and INVEST (b): Top figures present percentage of edentulous subjects (in black) and number of present teeth in dentate subjects (in red); while bottom figures present mean attachment loss (in black), and mean probing depth (in red) according to age cohorts (x-axis). p<0.001, p=0.02, and p=0.03 for interaction of study with age group for mean attachment loss, mean probing depth, and tooth count, respectively.

