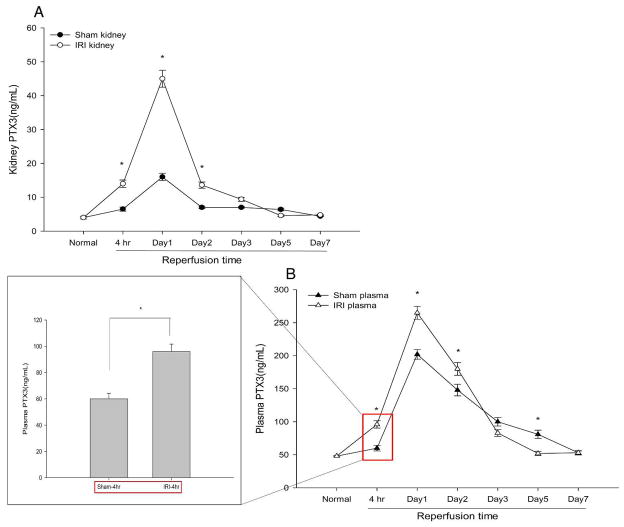
Figure 2.
PTX3 protein increases in kidney and plasma during AKI. Renal pedicles of WT mice were clamped for 16 min. Kidney samples were collected from normal kidneys and ischemic kidneys harvested at 4hr, day1, day3, day5, day7 reperfusion. Tissues were disrupted using homogenizer in RIPA buffer supplemented with protease inhibitors. Kidney protein concentration was determined by the Bradford assay in triplicate, and the same amount of protein from each kidney was assayed. Plasma and kidney PTX3 levels were measured using the Quantikine PTX3 immunoassay kit from R& D systems. (A) Time course study of kidney PTX3. Error bars represent mean ± SEM, n=4, *P< 0.001 compared to sham at each time point. (B) Time course study of plasma PTX3, Error bars represent mean ± SEM, n=4 per group, *P< 0.01 versus sham at the same time point. Plasma PTX3 at 4hr reperfusion was highlighted in red rectangle, and shown in the box.

