
Figure 2.
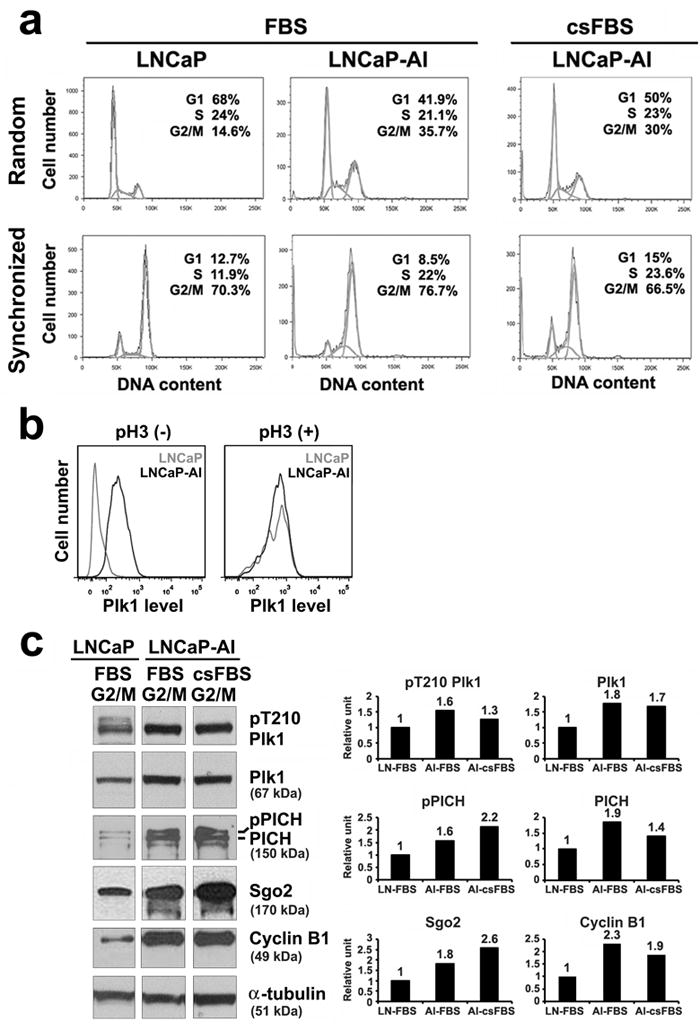
Plk1 is elevated and active in LNCaP-AI cells. Cells were cultured in either full media (FBS) or androgen-depleted media (csFBS). (a) FACS analysis of randomly growing cells and cells synchronized by nocodazole treatment to enrich for G2/M phase population. (b) FACS analysis of cells costained with Plk1 and a mitotic marker, phospho-histone H3 (pH3), in randomly cycling cells and in cells synchronized by a nocodazole treatment. pH3(-) represent non-mitotic cells; pH3(+) represent mitotic cells. (c) Lysates (20 μg) from cells enriched in G2/M by nocodazole treatment were analyzed by immunoblotting with antibodies shown. After scanning the blots (NIH ImageJ), protein levels were measured (protein/tubulin and normalized against the value in LNCaP cells). Similar data were obtained in n = 3 experiments.