
7.
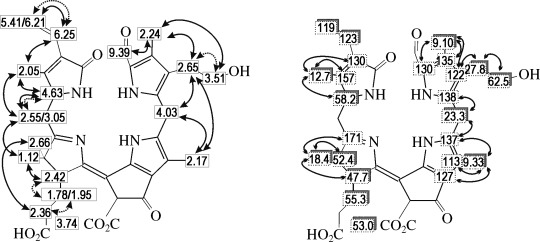
Molecular constitution of Mc-FCC-62 derived from 2D NMR data (500 MHz, CD3OD, 0 °C). Left: graphical representation of homonuclear 1H,1H correlations, arrows with dotted lines represent correlations from COSY, bold arrows represent correlations from ROESY; right: hetero-nuclear 13C,1H correlations, shadowed boxes indicate assignments from direct correlations, obtained from HSQC-spectra, arrows indicate assignments from long range coupling, obtained from HMBC-spectra.