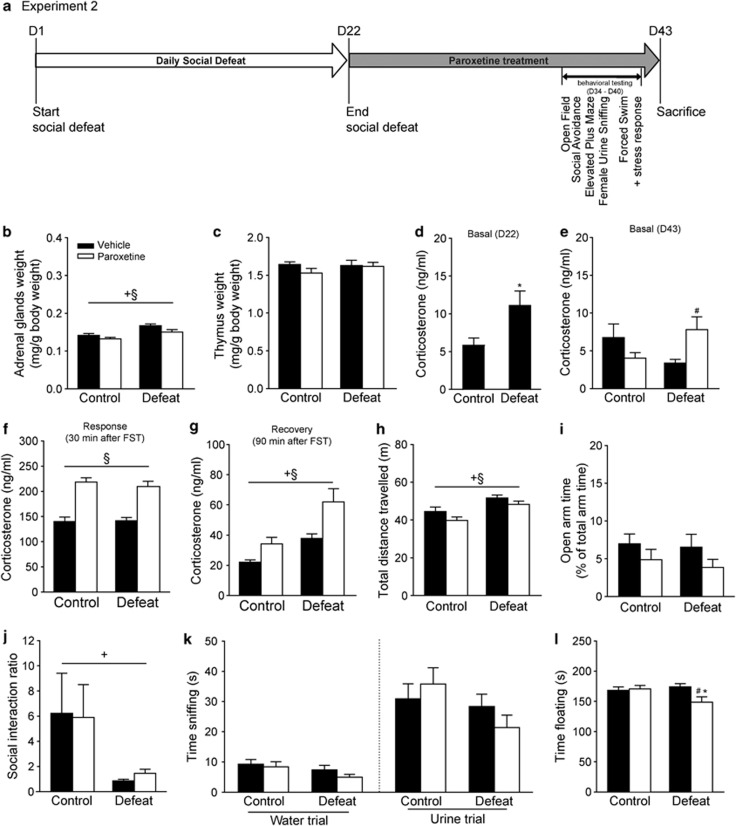
Figure 3.
Physiological and neuroendocrine effects of CSDS were still present after a recovery period of 3 weeks but behavioral alterations were mostly restored. (a) Time course of experiment 2: treatment with paroxetine commences after the stress procedure. The behavioral testing is performed in the last week of the treatment phase. (b) Investigation of the adrenal glands' weight revealed a condition (F1, 63=18.999, p<0.001) and a treatment effect (F1, 63=7.000, p<0.01). Adrenal glands were enlarged in stressed animals, but paroxetine diminished the stress effect. (c) Thymus weight was equal throughout all experimental groups. (d, e) Basal corticosterone levels directly after stress were increased (T62=−2.488, p<0.05) and subsequent paroxetine treatment disrupted HPA axis recovery to normal levels (ANOVA condition × treatment interaction (F1, 62=7.261, p<0.01)). (f) After challenging the animals with a novel acute stressor, paroxetine-treated mice showed an increased corticosterone response independent of condition in the response (ANOVA treatment: F1, 63=69.884, p<0.001). (g) At 2 weeks after cessation, CSDS led to an impaired ability to recover from an acute stressor, an effect that was strongly enhanced by paroxetine (ANOVA condition (F1, 63=17.708, p<0.001) and treatment effect (F1, 63=12.243, p<0.001)). (h) Stressed animals showed a hyperactive phenotype in the open field (ANOVA condition: F1, 63=17.028, p<0.001), whereas paroxetine treatment resulted in less activity (ANOVA treatment: F1, 63=4.543, p<0.05). (i, j) Although there was no effect on anxiety-related behavior, social interaction was still disrupted in mice that underwent the CSDS paradigm (ANOVA condition: F1, 59=5.186, p<0.05). (k) In the female urine sniffing test, no significant anhedonic effect could be found after recovery from the CSDS. (l) As in experiment 1, paroxetine exerted its antidepressant effects only in conjunction with CSDS as shown in reduced floating time in the forced swim test (ANOVA condition × treatment interaction: F1, 63=4.568, p<0.05). *Significantly different from control condition of the same treatment group, p<0.05; #Significantly different from vehicle treatment of the same condition group, p<0.05; +Significant condition effect, p<0.05; §Significant treatment effect, p<0.05; other abbreviations as in Figure 1.

