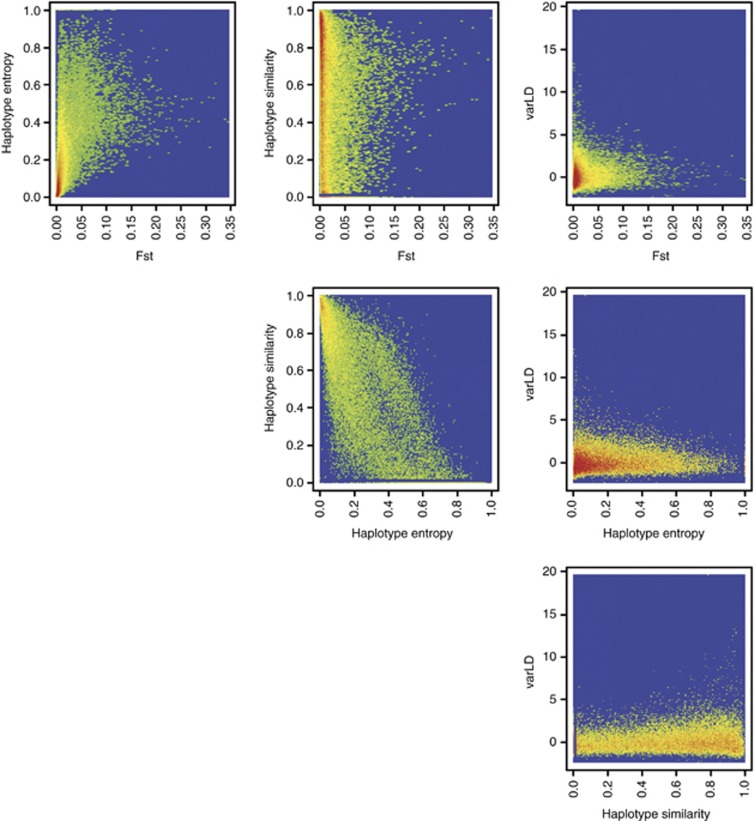
Figure 2.
Relationship between the four localized population diversity metrics. Each of the six panels illustrates the relationship between two population diversity metrics calculated from the population configurations used in the meta-analyses of two, three and four populations. Each figure is plotted in a density style where warmer colors indicate a greater concentration of data points while cooler colors represent sparser density, with blue as the background color of 0 density.

