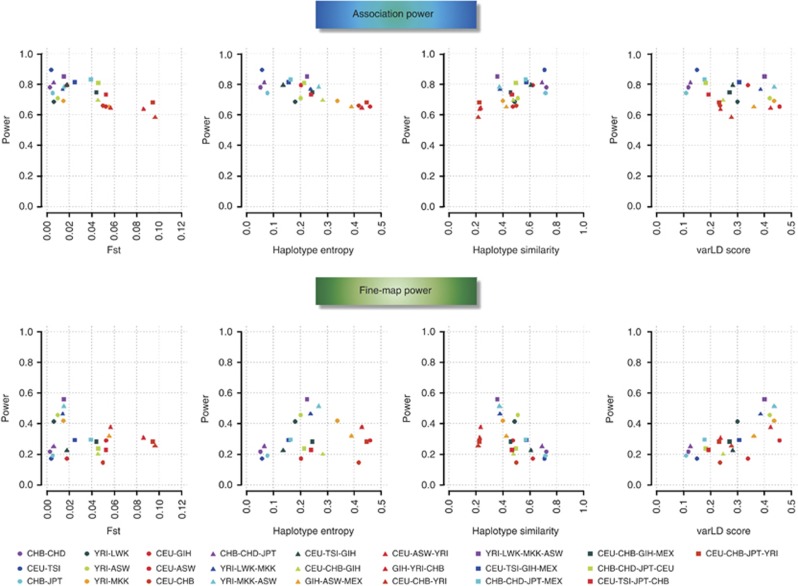
Figure 3.
Comparison of power with population diversity metrics. The panels in the top row show the power to identify an association when meta-analyzing different populations against four metrics of population diversity (regional FST, haplotype entropy, haplotype similarity and composite varLD). The panels in the bottom row are plotted against the same four metrics of population diversity, except the vertical axis measures the power of identifying the causal variant as the SNP with the strongest association signal. Results from the meta-analyses of two, three and four populations are represented with circles, triangles and squares, respectively, while the colors within each category are assigned according to the genome-wide FST between the corresponding populations, such that configurations with increasing FST are assigned warmer colors. This figure shows the findings for causal SNPs with MAFs between 20 and 50% in CEU.

