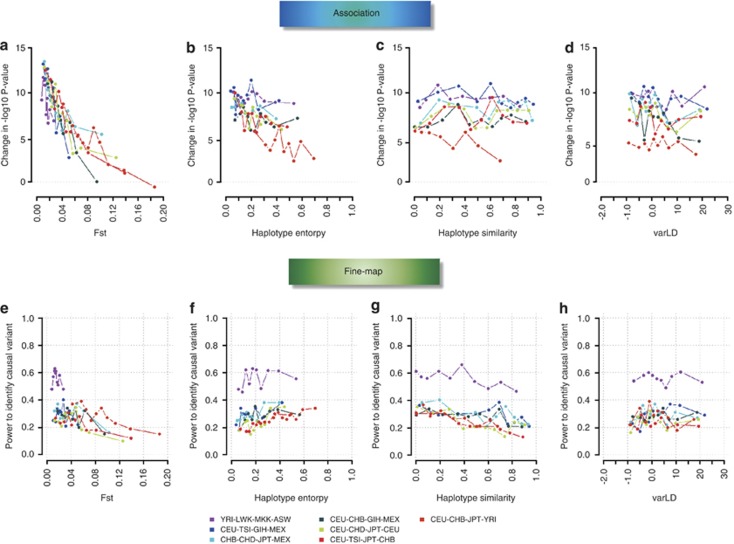
Figure 4.
SNP-level comparison of meta-analysis efficiency against population diversity metrics. The panels illustrate the efficiency of performing meta-analyses across four populations for the different population diversity metrics. The efficiency of the meta-analysis for identifying association is quantified as the difference in the –log10P-values of the meta-analysis from the most significant single-population analysis (a–d), whereas the efficiency for fine-mapping is quantified as the ability to identify the causal variant as the SNP exhibiting the strongest association signal (e–h). Across the 1000 simulated causal variants, the deciles for each population metric are identified, and the averages of the efficiency metrics are calculated for the 100 SNPs falling within each decile. This figure shows the findings for causal SNPs with MAFs between 20 and 50% in CEU.

