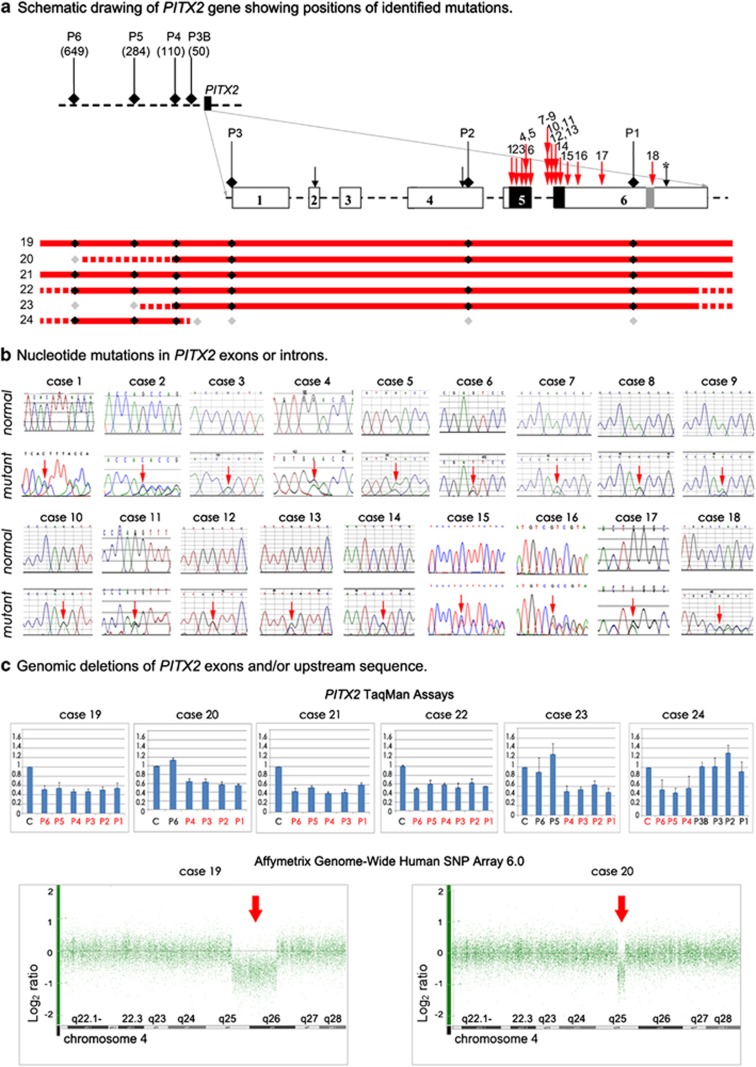
Figure 2.
Summary of PITX2 mutations identified in this study. (a) Schematic drawing of PITX2 gene and upstream region. Identified point mutations are shown with red numbered arrows (1–18) whereas identified deletions are shown as red lines (19–24); the solid line shows the minimum deletion size, with the dashed line representing the maximum extent of the deletions. PITX2 exons are shown as numbered boxes, regions corresponding to the homeobox and 14-amino-acid-conserved domains are indicated as black and light gray boxes, respectively. Initiation codons corresponding to the PITX2 isoforms are shown with black arrows. The stop codon is indicated with a black arrow and asterisk. The positions of the TaqMan probes are shown and labeled P1–P6; for upstream probes P3B and P4–P6, the distance (in base pairs) from the beginning of the gene is indicated in parenthesis. The positions of probes that demonstrated haploid state are shown as black diamonds, whereas probes that showed diploid state are shown as gray diamonds. (b) DNA sequencing chromatograms for normal and mutants alleles; mutation position is indicated with an arrow. (c) Copy number analysis (TaqMan assay and Affymetrix array) data. For PITX2 TaqMan assays, probes P1–P3 correspond to PITX2 exons and probes P3B and P4–P6 correspond to the upstream region, patient sample values were compared with control (C) results for every assay. Probes that showed half of the normal value are noted in red. For Affymetrix array analysis, Genotyping Console representation of chromosome 4 marker data is shown with heterozygous deletions indicated with arrows. The color reproduction of this figure is available at the European Journal of Human Genetics online.

