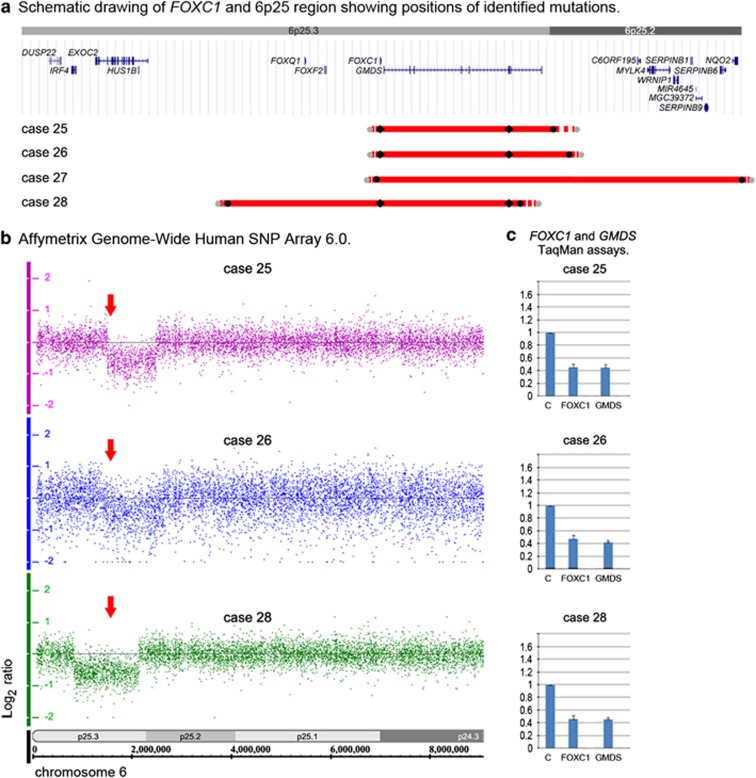
Figure 3.
Summary of FOXC1 deletions identified in this study. (a) Schematic drawing of the 6p25 region. All known human protein-coding and non-protein-coding genes from the NCBI RNA reference sequences collection (RefSeq) for the selected region are shown as seen in the UCSC Genome Browser (http://www.genome/ucsc.edu); GRCh37/hg19 assembly was utilized. Identified deletions are shown as red lines (25–28); the solid line shows the minimum deletion size, with the dashed line representing the maximum extent of the deletions. The positions of the TaqMan probes that demonstrated haploid state are shown as black diamonds; the positions of the Affymetrix probes that exhibited haploid state are shown as black circles and probes that displayed diploid state as gray circles. (b) Affymetrix array identification of FOXC1/6p25 deletions. Genotyping Console representation of chromosome 6 marker data for cases 25, 26 and 28 is shown with FOXC1 position within the heterozygous deletions indicated with arrows. (c) Copy number analysis using TaqMan assays showing deletion of FOXC1 and GMDS for cases 25, 26 and 28. Patient sample values were compared with control (C) results for every assay. The color reproduction of this figure is available at the European Journal of Human Genetics online.

