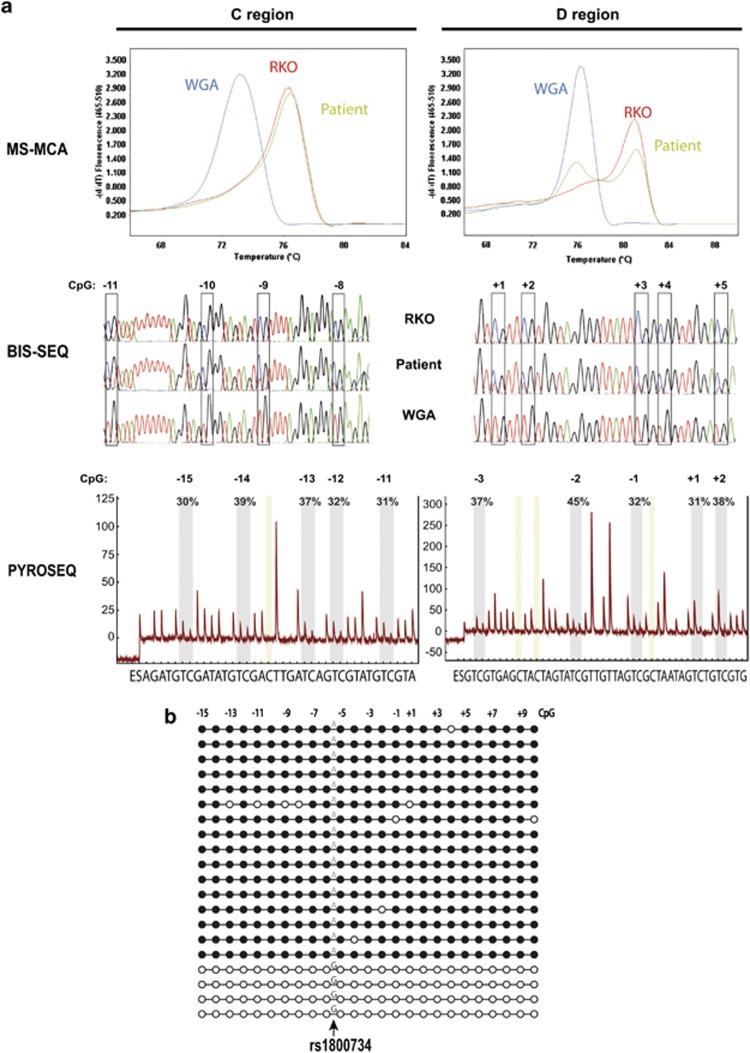
Figure 2.
Confirmation of the constitutional MLH1 epimutation of case 1. (a) Analysis of the MLH1 promoter C and D regions by methylation-specific melting curve analysis (MS-MCA), bisulfite sequencing (BIS-SEQ) and pyrosequencing (PYROSEQ). Top panel: MS-MCA of MLH1 promoter. In the analysis of C region, WGA DNA (unmethylated control) and RKO DNA (methylated control) show single melting peaks at 73 and 77° C, respectively. In D region, WGA and RKO melting peaks temperature are 76 and 82° C, respectively. Analysis by MS-MCA in PBL DNA from the patient 1 (green line) shows the presence of the methylated peak in both regions. Middle panel: sequence analysis of bisulfite-converted DNA. WGA DNA shows T at each CpG analyzed, consistent with complete modification of the DNA. RKO DNA shows C at each CpG. Patient DNA shows a mixture of T and C at CpG sites, attributable to partial methylation. Bottom panel: representative pyrograms obtained in the analysis of C and D MLH1 promoter regions in PBL DNA from the patient. The peaks within the shaded area of the pyrogram correspond to the CpG interrogated. Percentage methylation at each site is calculated as the C:T ratio of peak heights (representing methylated:unmethylated cytosine). x axis represents the nucleotide dispensation order. y axis units are arbitrary representing light intensity. (b) Clonal bisulfite sequencing of the MLH1 promoter in PBL DNA from the epimutation carrier 1. Each horizontal line represents a single allele. CpG dinucleotides are depicted by circles. Black and white circles indicate methylated and unmethylated CpG, respectively. The allele at rs1800734 (c.−93G>A) is indicated as A or G. Methylation is confined to the A allele. Each CpG analyzed is numbered according to its position relative to the translation initiation codon.

