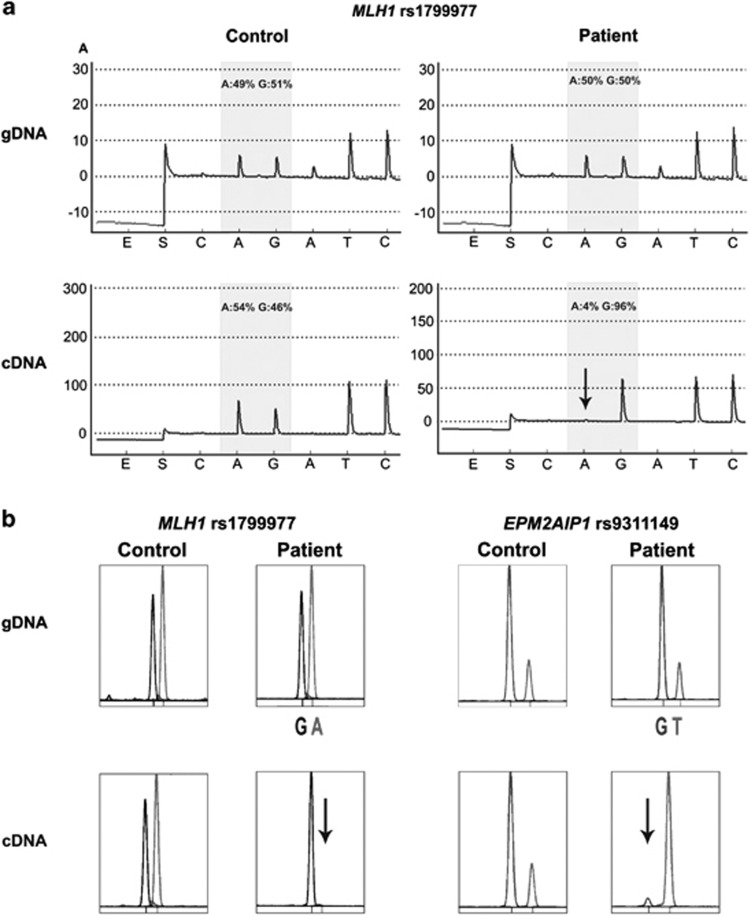
Figure 3.
Transcriptional inactivation of MLH1 and EPM2AIP1 alleles. (a) Illustrative example of the pyrogram across the expressible MLH1 rs1799977 (c.655A>G) in genomic DNA (gDNA) (top panels) and cDNA (bottom panels) derived from a heterozygous healthy control (left panels) and the epimutation carrier (right panels). The peaks within the shaded area of the pyrogram are the nucleotides at the SNP site, quantified with respect to neighboring nucleotides. Their relative values are given as percentage values above the pyrogram trace. There was a transcriptional inactivation of the ‘A' allele (indicated with a downward arrow) in the cDNA of the patient with the MLH1 epimutation. x axis represents the nucleotide dispensation order. y axis units are arbitrary representing light intensity. (b) Representative results of the SNuPE analysis at MLH1 rs1799977 (c.655A>G) (left panel) and EPM2AIP1 rs9311149 (right panel) in gDNA and cDNA derived from a heterozygous control and the epimutation carrier. Transcriptional silencing of the A allele at MLH1 rs1799977 and T allele at EPM2AIP1 rs9311149 in the cDNA of the patient was observed.

