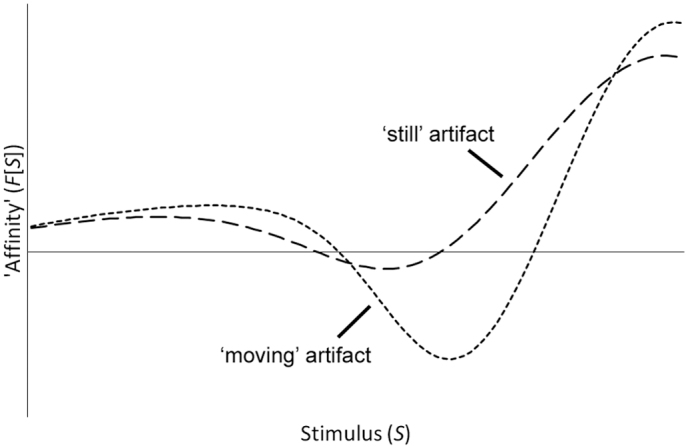
Figure 4. Prediction of the Mori curves.

An increase in clarity for the target category (implemented in the model as a reduction of the target variance) leads to a response curve which is higher at the category means and lower at the category boundary. This mimics the difference between ‘still’ and ‘moving’ artifacts illustrated in Mori's original diagram (Fig. 1).
