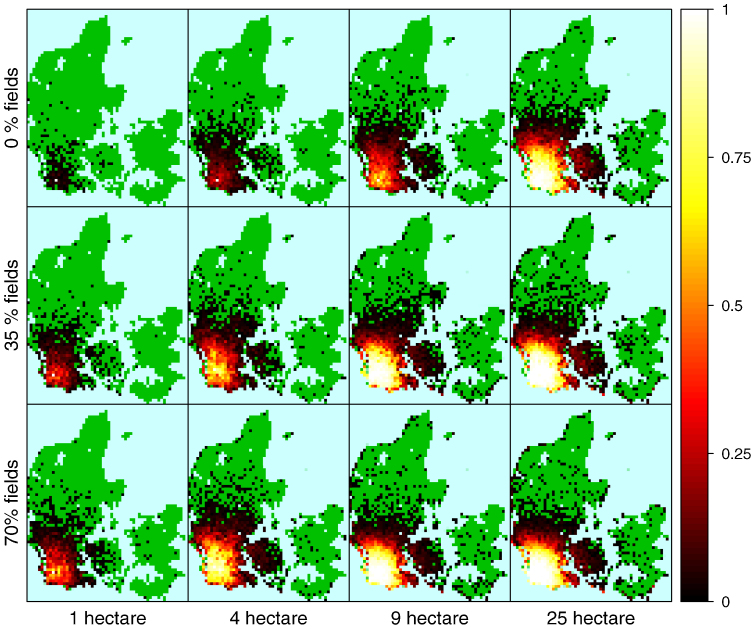
Figure 2. Influence of vector homing range and cattle distribution on spread of Bluetongue Virus.
Fraction of simulations that show presence of disease within a 5 by 5 km pixel for introduction of infection at day 170 repeated 100 times. Rows have cattle distributed from 0% of cattle grazing on fields (all within farm buildings) to 70% on fields. Columns have the area in which vectors are able to locate hosts ranging from 1 to 25 hectare. The color green indicates pasture were no cattle were infected with Bluetongue. The color blue indicates area with no Danish pastures.

