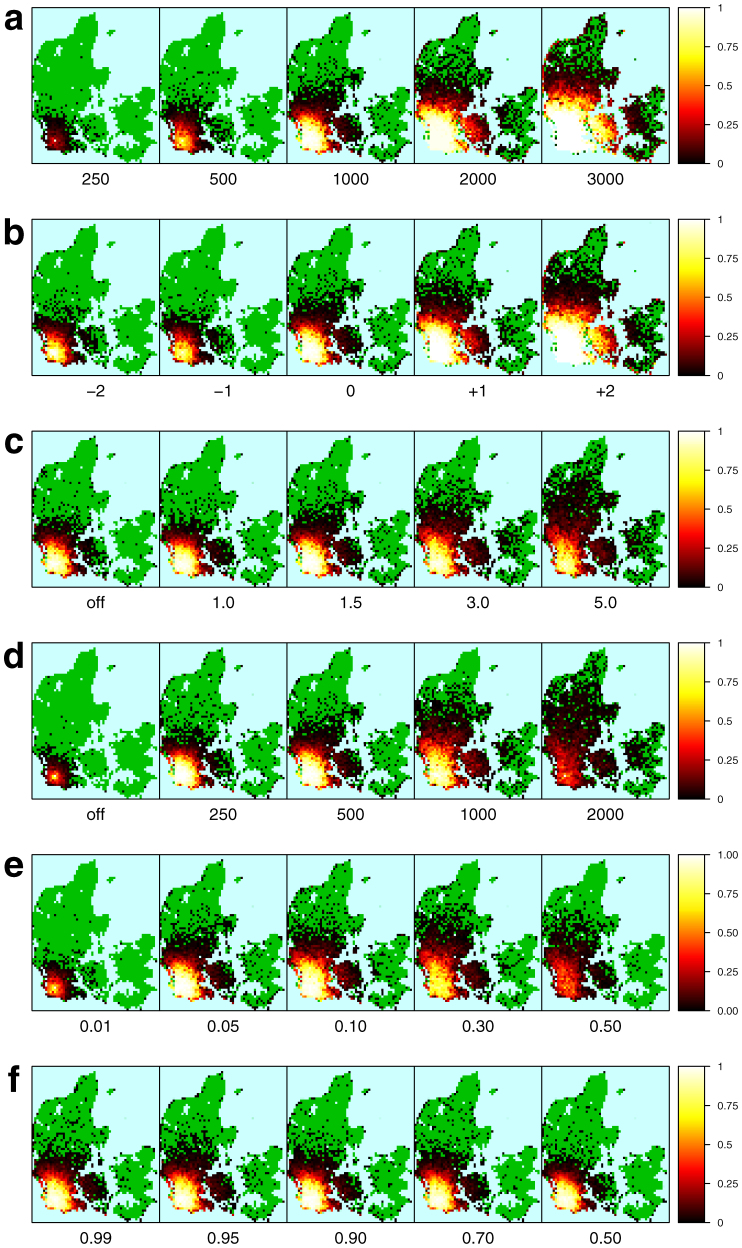
Figure 4. Spread of Bluetongue virus.
Fraction of 5 by 5 km pixels that show presence of virus for infection day 170 repeated 100 times as a function of: (a) the maximum number of vectors to host, mM; (b) the 2008 Danish temperatures with offset [°C]; (c) the flight time in the wind [h], tW; (d) the active local flight length [m], dL50; (e) the fraction of vectors leaving area with hosts [1/day], ηH; and (f) the fraction of vectors leaving area with no hosts [1/day], η!H. Grid cell size were 300 by 300 m, with 35% of hosts on pasture. The color green indicates pasture were no cattle were infected with Bluetongue. The color blue indicates areas with no Danish pastures.

