Figure 3.
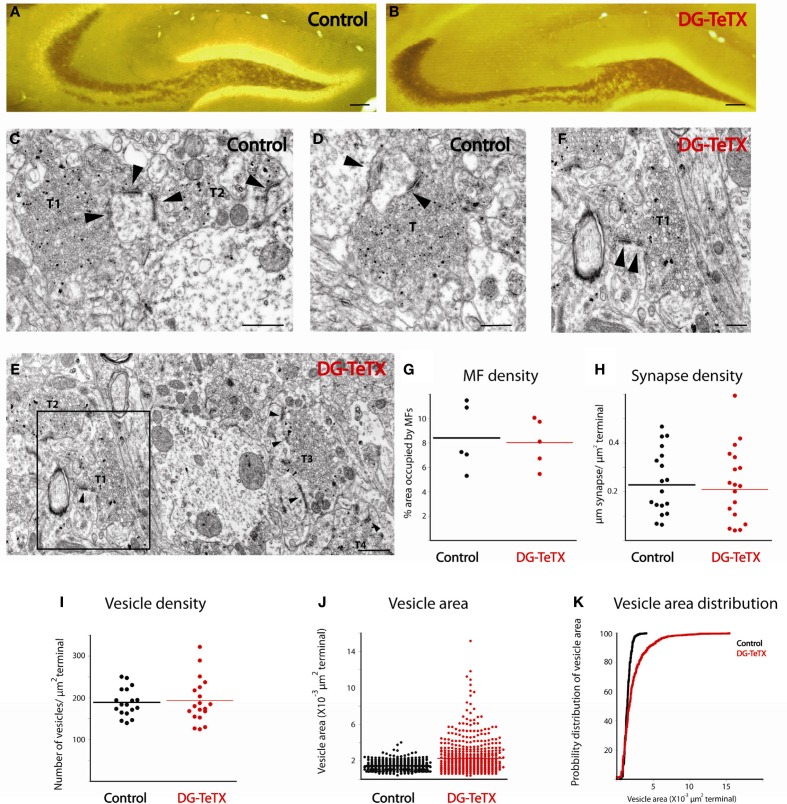
Ultrastructural comparison of active and silenced MF terminals. (A,B) Mossy fiber tracks in representative sections from control (A) and DG-TeTX (B) mice are labeled with neoTimm staining. (C–F) Representative electron micrographs demonstrate that mossy fiber terminals (T) form multiple synaptic contacts (arrowheads) with their postsynaptic targets in control (C,D) and in DG-TeTX (E,F) mice. Zinc-labeled terminals (T1–T3) are abundant in the stratum lucidum of DG-TeTX samples (E), T1 is shown in panel F at higher magnification where the high degree of variability in vesicle size is clearly evident. (G) The density of mossy fibers measured as a ratio of the percentage of surface area covered by zinc-positive large presynaptic specializations was similar in the stratum lucidum of control and DG-TeTX animals (n = 5 sections per animal, 1 mouse per genotype). (H,I) Synapse density (H, n = 20 terminals examined across the 5 sections for each genotype) and vesicle density (I, n = 20 terminals examined across the 5 sections for each genotype) was also comparable between the two groups. (J) Plots of vesicle area reveal a typical uniform vesicle size in control samples but a higher degree of variability in DG-TeTX mice. (K) Cumulative probability distribution of vesicle size measurements plotted in (J) revealing the skew toward larger vesicles in DG-TeTX mice (n = 620 vesicles in 20 terminals across 5 sections from 1 mouse per genotype). Scale bars: (A,B: 200 μm, C–E: 400 nm, F: 800 nm).

