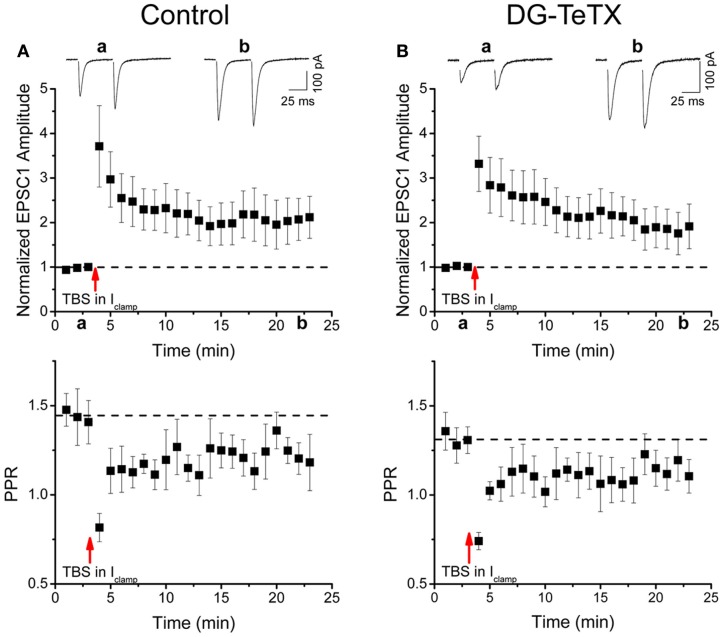
Figure 5.
Normal LTP of perforant path inputs to old GCs in activated DG-TeTX mice. (A,B) The upper panels are pooled data time course plots showing LTP of perforant path-evoked AMPA receptor-mediated EPSCs in response to a theta burst induction protocol in old GCs of control (A, n = 5 cells from 3 animals) and activated DG-TeTX (B, n = 6 cells from 4 animals) mice. Inset traces show EPSCs taken at the times indicated on the x-axis. Lower panels show the corresponding pooled data time course plots of the paired pulse ratios for AMPA receptor-mediated EPSC peak amplitudes (PPRS) in control and activated DG-TeTX mice.

