Figure 1.

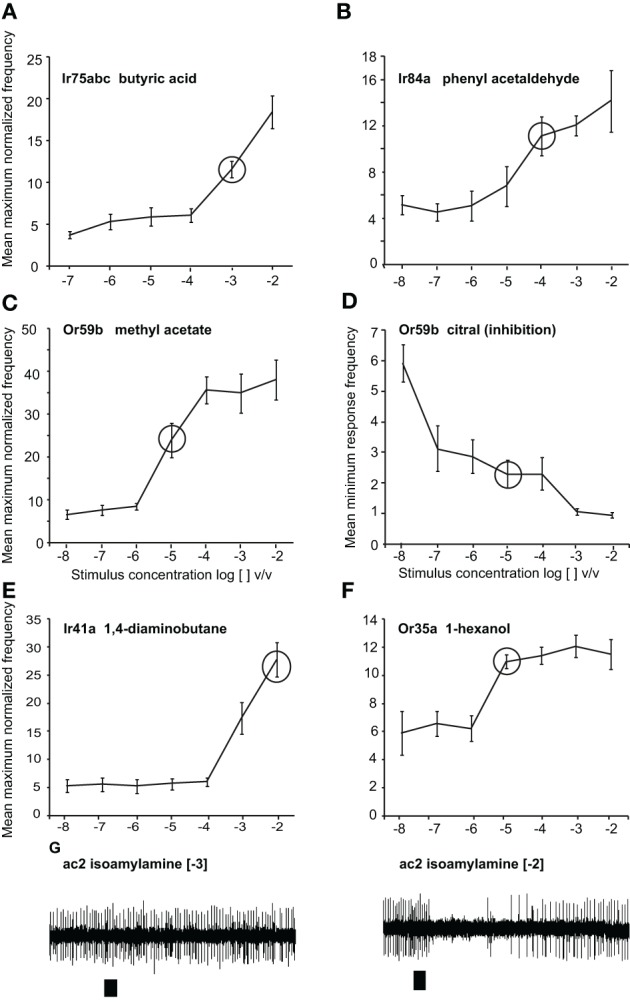
Responses to odors at different doses. Dose-response curves presented as normalized maximum frequency response for (A) Ir75abc-expressing neurons to butyric acid n = 8–13 (B) Ir84a-expressing neurons to phenylacetaldehyde, n = 9–12. (C), Or59b-expressing neurons to methyl acetate, n = 8–17 (D) Or59b-expressing neurons to citral presented as the minimum frequency, n = 6–10. (E) Ir41a-expressing neurons to 1, 4-diaminobutane n = 6–8 (F). Or35a-expressing OSNs to 1-hexanol, n = 6–8. (G) Representative traces showing the response of OSNs of ac2 sensilla to isoamylamine at two different concentrations (responses to lower concentrations were not observed). Please note that while only Ir41a-expressing neurons are excited by 1, 4-diaminobutane in this sensillum (ac2), all neurons are inhibited by isoamylamine, and we thus label the inhibitory responses with the entire sensillum label.
