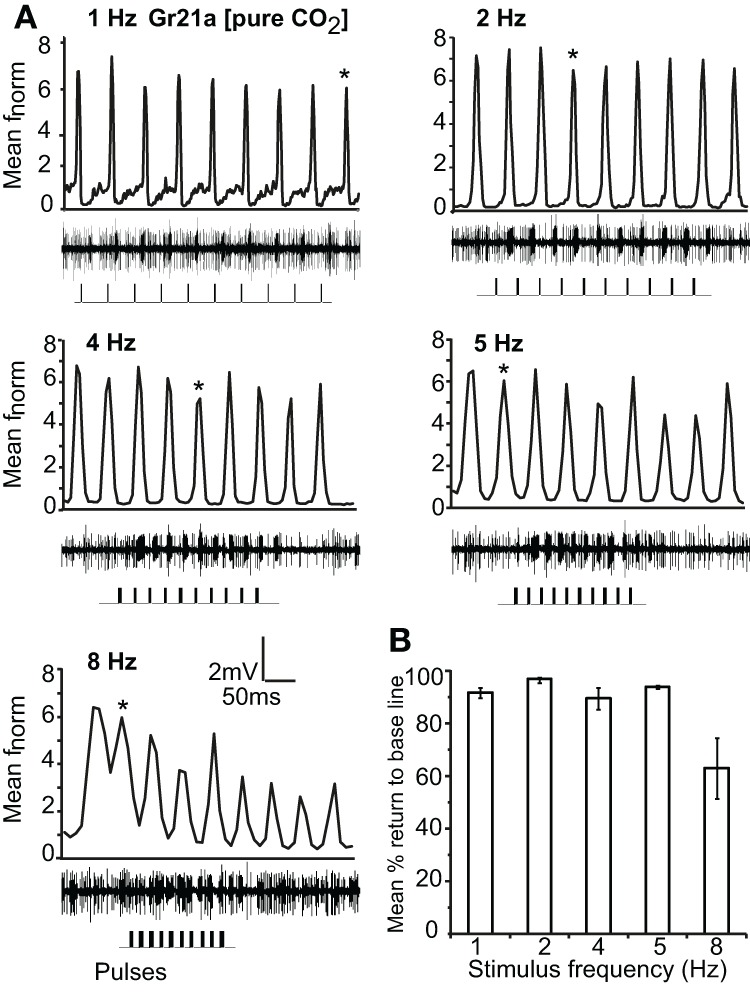
Figure 5.

Response of Gr21a-expressing OSNs to repeated stimulus pulses at varying frequencies. (A) Average normalized PSTH responses of Gr21a-expressing neurons to repeated pulses of pure CO2 at listed frequencies. Traces below each panel show sample 50 ms recordings. Square pulses indicate stimulus presentation. (B) Mean percent return to base line across all pulses of listed frequencies, error bars indicate SEM (ANOVA, P < 0.05, followed by Tukey post-hoc test, n = 11–12).
