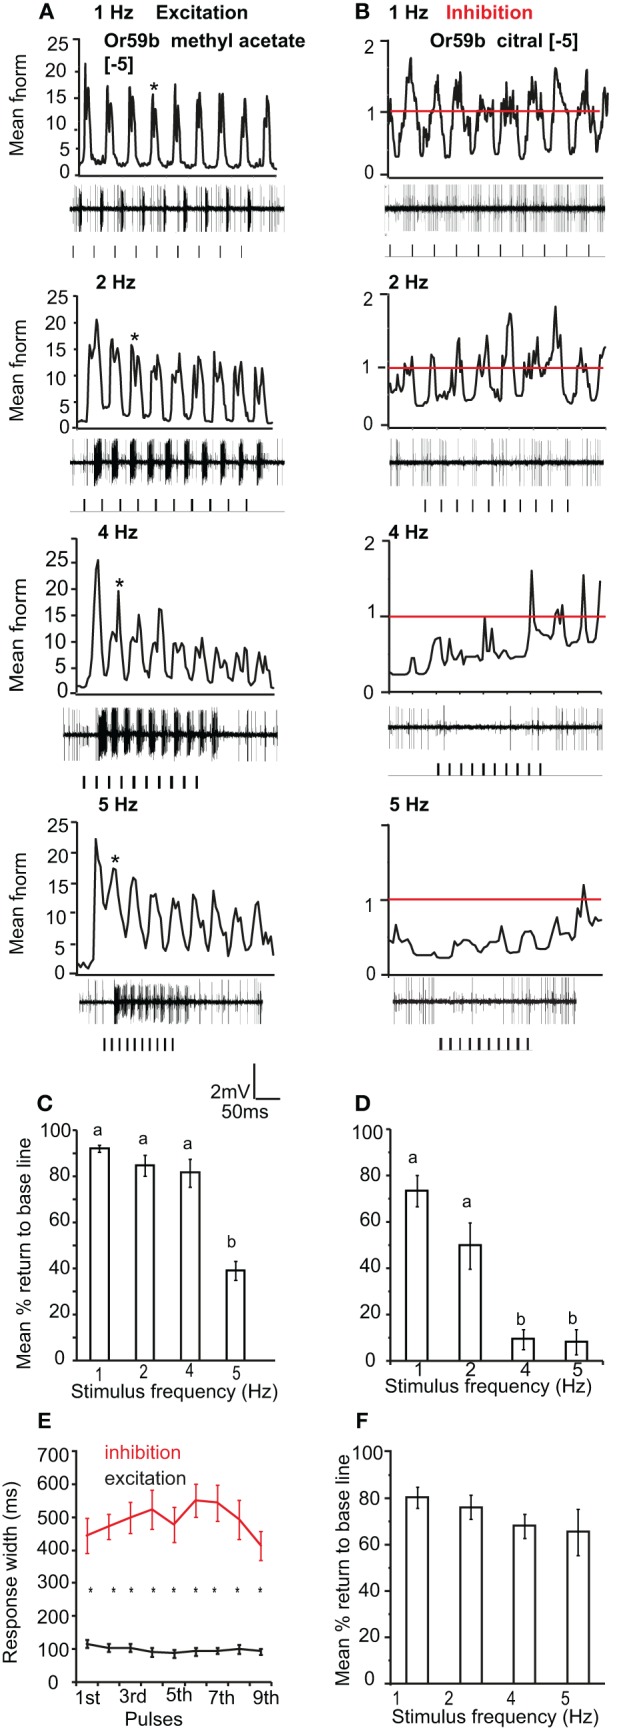
Figure 6.

OR-expressing OSN response polarity and pulse resolution. (A) Mean normalized PSTH response of Or59b-expressing OSNs to repeated pulses of log [−5] v/v methyl acetate at listed frequencies. Traces below each panel show sample 50 ms recordings. Square pulses indicate stimulus presentation. (B) Mean normalized PSTH response of Or59b-expressing OSNs to repeated pulses of log [−5] v/v citral (an inhibitory odor) at listed frequencies as in (A). Red line indicates baseline frequency. (C) Mean percent return to base line across all pulses for Or59b-OSN response to methyl acetate, error bars indicate SEM (ANOVA, P < 0.05, followed by Tukey post-hoc test, n = 9–13) and (D) as in (C) for citral (ANOVA, P < 0.05, followed by Tukey post-hoc test, n = 13–15). (E) Mean response width of Or59b-expressing OSNs for excitation and inhibition. (F) Mean percent return to base line in response to a pulsed binary mixture of methyl acetate and citral, error bars indicate SEM, (P > 0.05 ANOVA, n = 8–9).
