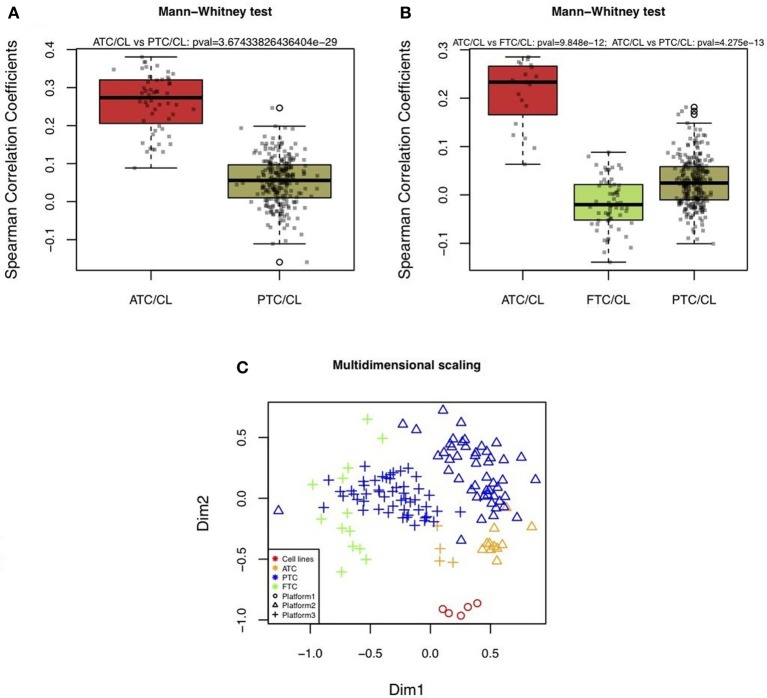
Figure 2.
Boxplots of correlations between cell lines and in vivo thyroid tumors. (A and B) Correlations were calculated based on 2,392 mRNA expressions comparing human thyroid cancer cell lines (CL) with different types of in vivo human thyroid tumors by using three datasets. The first was composed of five thyroid cancer cell lines (WRO, FTC133, BCPAP, TPC1, 8505C) hybridized on IRIBHM custom slides. The second was composed of 11 ATC and 49 PTC hybridized on Affymetrix HG U133 Plus 2.0 (A). The third was composed of 4 ATC, 13 FTC, and 51 PTC hybridized on Affymetrix HG U133A (B). P-values indicate whether ATC and cell lines had more similar profiles than FTC or PTC and cell lines. P-values were significant for both independent datasets. (C) 2D-multidimensional scaling representation of the mRNA expression profiles of cell lines, ATC, PTC, and FTC based on 2392 mRNA expressions.

