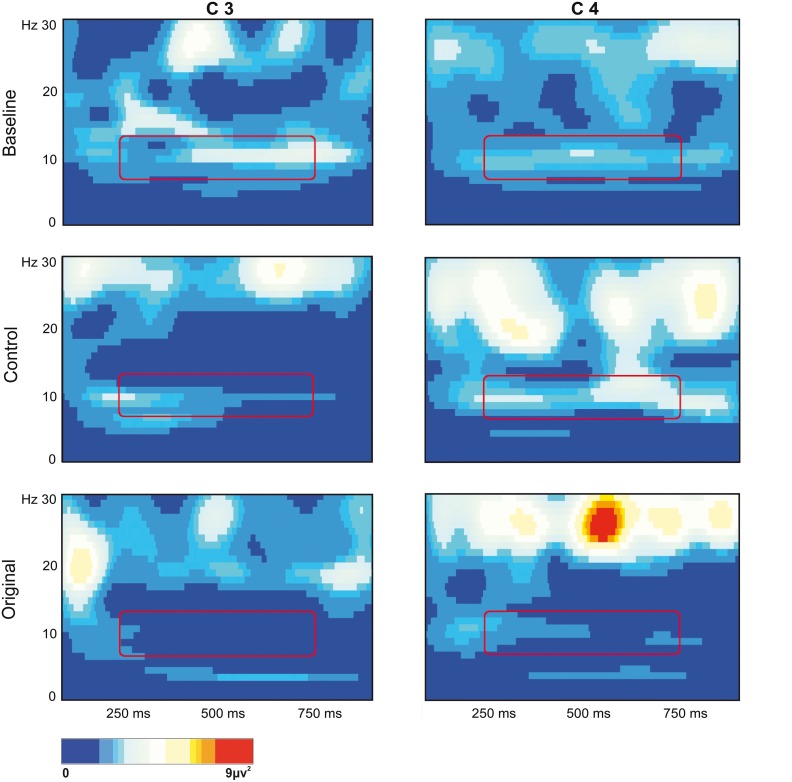
Figure 3.
EEG time-frequency spectrum of one participant extracted from C3 and C4 sites in the two experimental Conditions and in the Baseline. A continuous wavelet transformation was performed for the frequencies from 1 to 30 Hz in a time window of 1 s, which corresponds to the total duration of stimulus presentation. Red color indicates increased mu rhythm squared amplitude, while blue color indicates decreased mu rhythm squared amplitude in a given frequency band (see scale bar). The rectangles added to each panel highlight the 7 Hz wide frequency band (8–14 Hz) and the time window (250–750 ms) used for statistical analysis.

