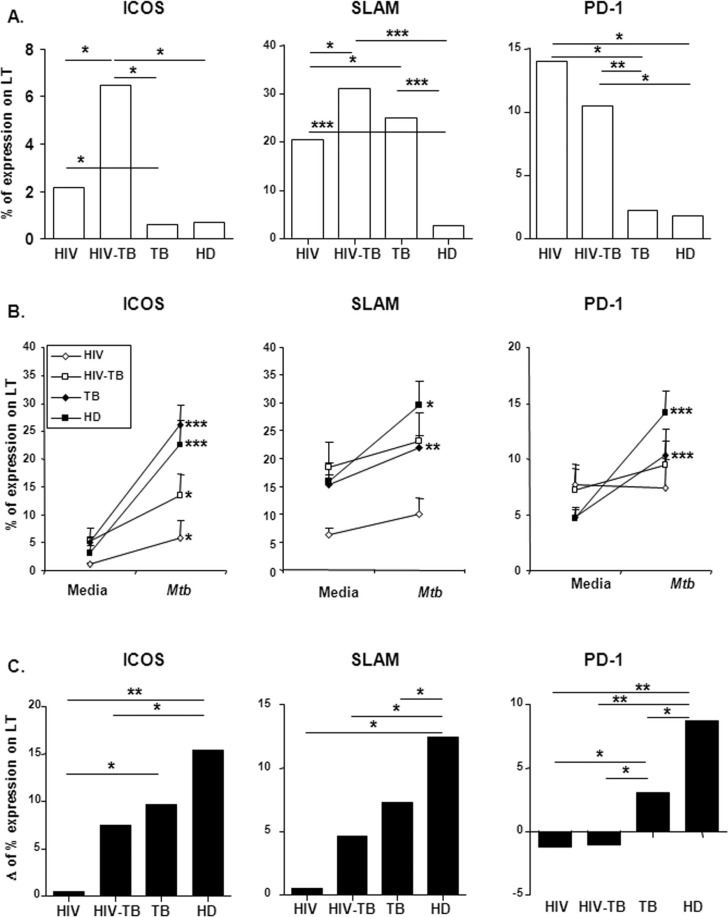
Figure 2.
Expression and regulation of costimulatory molecules on T lymphocytes before and after M. tuberculosis stimulation from HIV, HIV-TB, TB and HD individuals. (A) PBMC from individuals belonging to each group were stained for ICOS, SLAM or PD-1 and the expression of each molecule was evaluated using two-color flow cytometry. ICOS, SLAM or PD-1 expression on T cells was determined by first gating on total CD3+ cells, then evaluating each molecule expression. Bars represent the median of ICOS, SLAM or PD-1 basal expression for each group. (B) PBMC from patients and HD were cultured in the presence or absence of sonicated M. tuberculosis. ICOS, SLAM or PD-1 expression was determined on T cells after five-day stimulation as in (A). The mean±SEM for each molecule expression is shown. (C) Increment in ICOS, SLAM and PD-1 expression from media levels was evaluated on T cells from individuals belonging to each group. The values of delta (Δ) were calculated as follows: percentage of CD3+ molecule+ T cells after M. tuberculosis stimulation − percentage of CD3+ molecule+ T cells after culture with medium. The median of molecule's delta is shown for each group. Ten individuals per group were evaluated. *p<0.05, ***p<0.005. HD, healthy donors; PBMC, peripheral blood mononuclear cells; ICOS, inducible costimulator; SLAM, signalling lymphocytic activation molecule; PD-1, programmed death-1.

