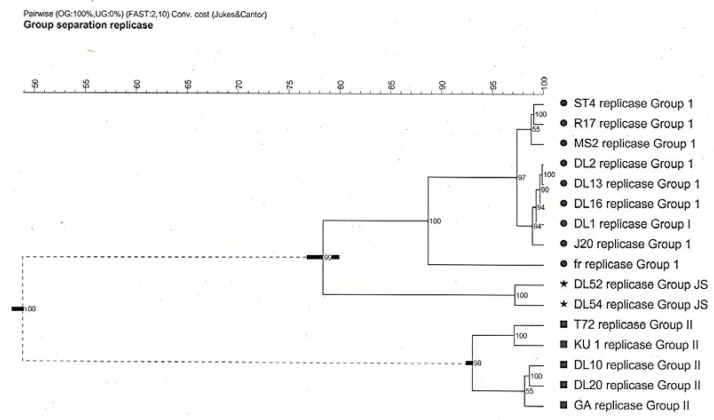
Figure 2.
Cophenetic cluster analysis of Levivirus (family Leviviridae) genogroups I and II strains generated from pairwise similarities of the replicase amino acid sequences. Horizontal bars at three of the branches show the standard deviations of the average similarities of the clusters. Numbers at each branch are the cophenetic correlations which represent the faithfulness of the clusters. Two relevant clusters, as determined by the cluster Cutoff method, are grouped as dictated by the dashed lines. Analysis performed in Bionumerics.

