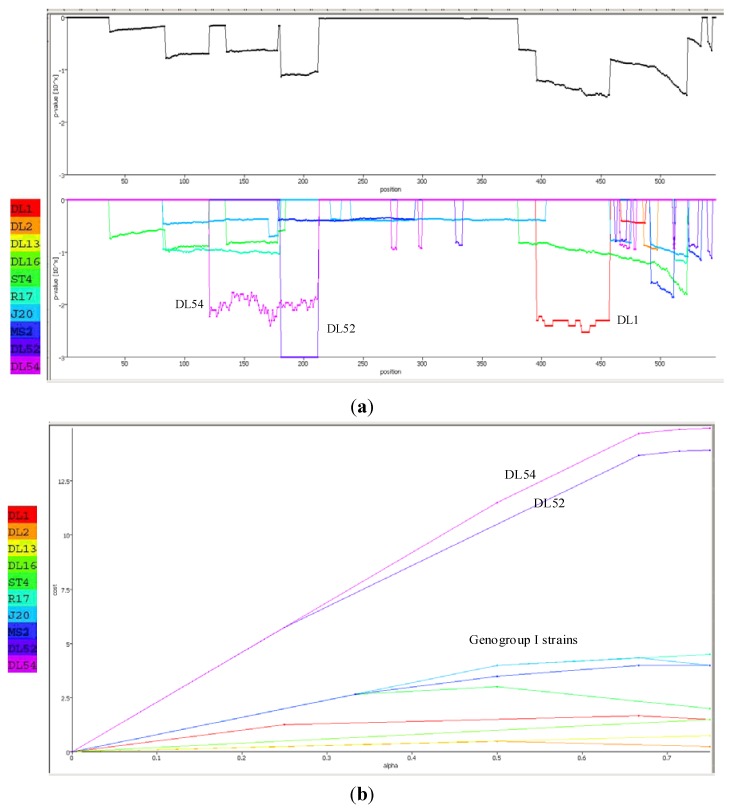
Figure 6.
(a) Recco analysis of the RNA-dependent RNA polymerase (replicase) amino acid sequences in Levivirus genogroup I male-specific coliphages (FRNA). Recombination events are displayed by downward peaks in the graphics dataset. The upper graph represents the p-value for recombination at each position along the replicase gene. The lower graph is the breakpoint p-values for the entire set of Levivirus genogroup I and JS strains DL52 and DL54; (b) Recco parametric cost curve analysis of the RNA-dependent RNA polymerase (replicase) amino acid sequences for each FRNA strain in Levivirus genogroup I and JS strains DL52 and DL54. The y-axis corresponds to the cost curve and the x-axis represents α (0–1).

