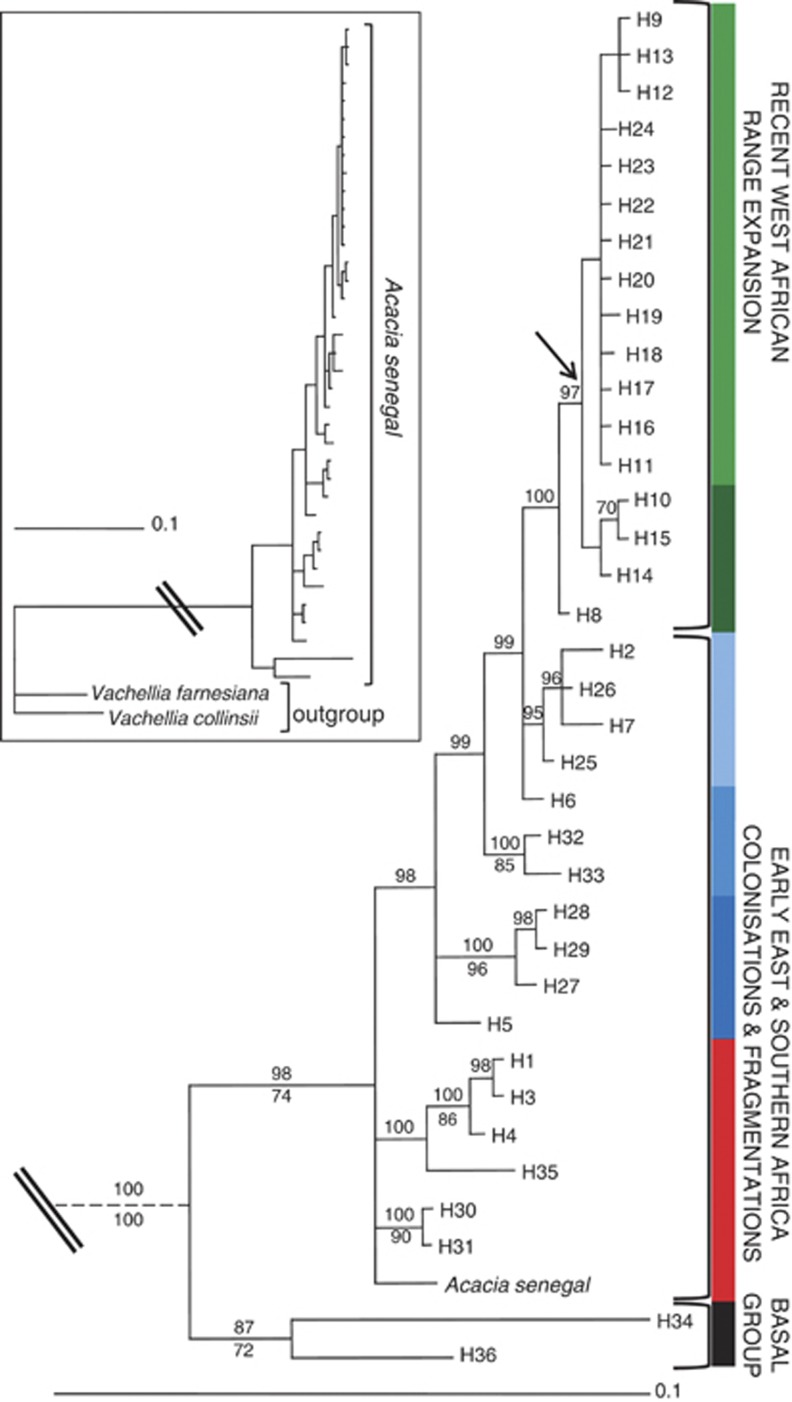
Figure 1.
Bayesian 50% majority-rule consensus phylogram of ITS sequences from Acacia senegal individuals sampled across its distribution range. Branches are labelled with ⩾70% bootstrap support (below) and posterior probability (above) values. Arrow indicates presence of a single clade in the maximum parsimony strict consensus tree. The tree was rooted with Acacia (Vachellia) farnesiana and Acacia (Vachellia) collinsii (see inset tree, double line denotes the point at which the break is in the main tree) obtained via GenBank (accession numbers EF638219 and EF638216, respectively). Acacia (Senegalia) senegal sequence is accession number EF638213 from Zimbabwe. Each haplotype is code-labelled HX where X refers to a number 1–36 as described in Supplementary Table S2, Supporting information. Hypothesised colonisation or range expansion events are indicated. Clades are identified by different colours on the vertical bar (black, basal group; red, var. leiorhachis; dark blue, var. rostrata; blue–light blue, vars. kerensis-senegal; dark green–light green, var. senegal); clades that are phylogenetically related are shown with different shades of one colour. The same colour coding is used for Figure 2a. Scale bar signifies 0.1 substitutions per nucleotide site.

