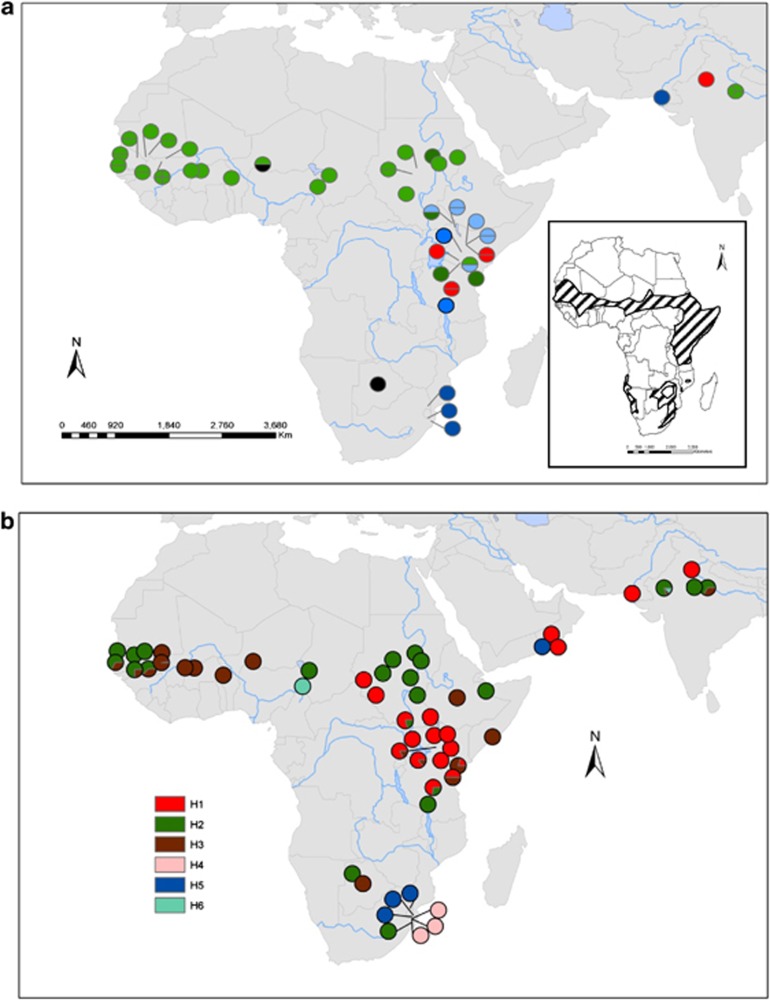
Figure 2.
Rangewide distribution of nuclear (a) and chloroplast (b) haplotypes in Acacia senegal. Data are: (a) haplotypes from ITS of the nuclear ribosomal DNA and (b) PCR-RFLP haplotypes of chloroplast trnH-psbA intergenic spacer of A. senegal; each circle represents a single population with colour denoting haplotype variation. The number of samples per population is presented in Supplementary Tables S2 and S3, respectively. Inset: approximate distribution of A. senegal in Africa (hatch-shaded area).

