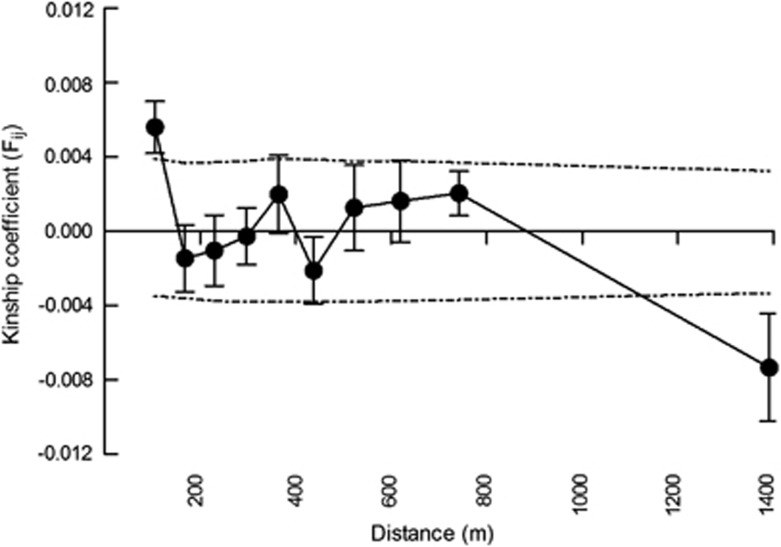
Figure 4.
Spatial autocorrelation analysis of adult O. bataua from Bilsa Biological Station, northwest Ecuador. Mean kinship coefficient (Fij)±s.e. plotted against distance. Dashed lines are the upper and lower 95% confidence intervals around the null hypothesis (Fij=0) determined by permutation testing.

