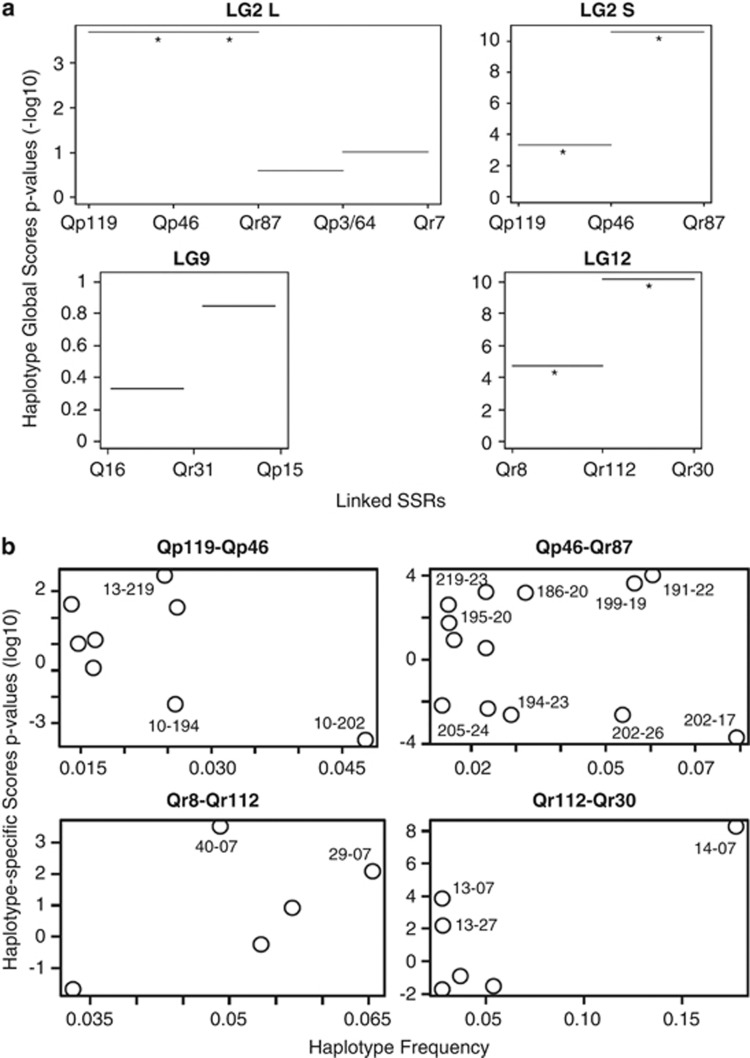
Figure 4.
Haplotype score tests. (a) Global haplotype score P-values, on a logarithmic scale, are represented by horizontal bars for contiguous two-marker haplotypes. Significant scores are indicated by asterisks. (b) Logarithmic haplotype-specific scores P-values (represented by circles) are plotted against the haplotype frequencies. Significant scores are labeled with the corresponding haplotype codes. Positive scores indicate association with Q. petraea and negative scores with Q. robur.

