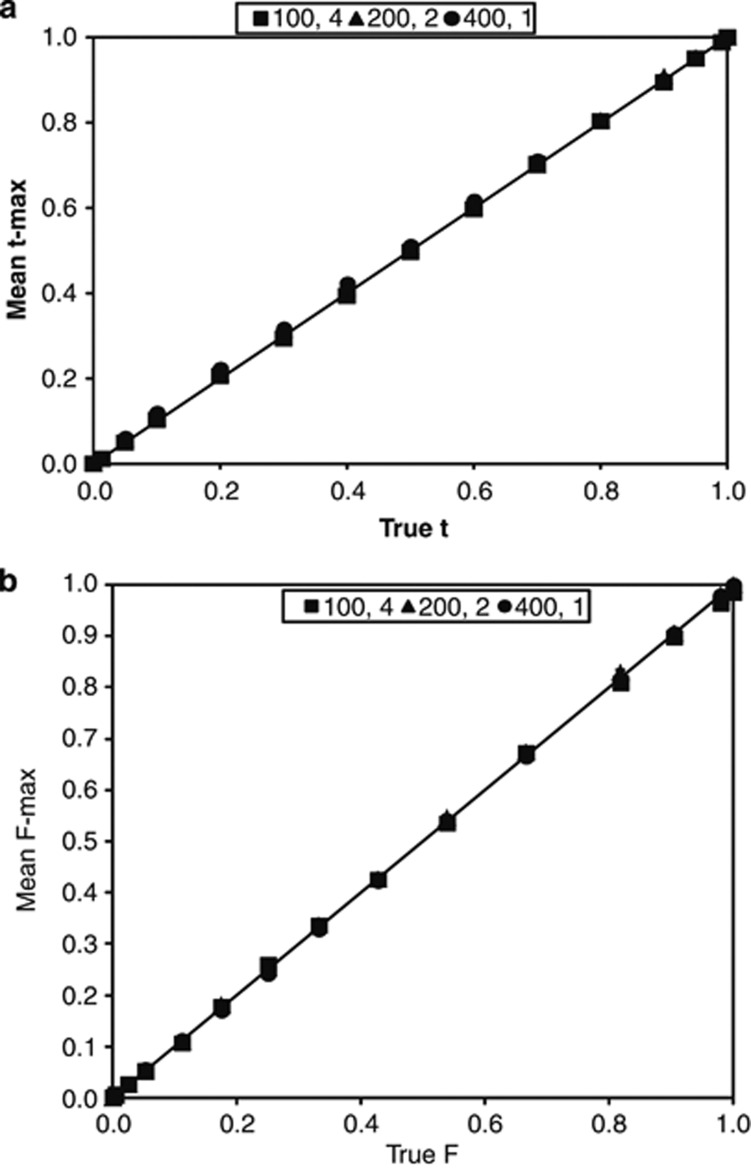
Figure 2.
Estimation of the population outcrossing rate (t) and adult inbreeding coefficient (F) in BORICE using three experimental designs with small family sizes. Mean t-max (a) and F-max (b) are reported from simulations of the same parameter combinations in Figure 1. The solid black line represents no difference between the mean estimate and the true value.

