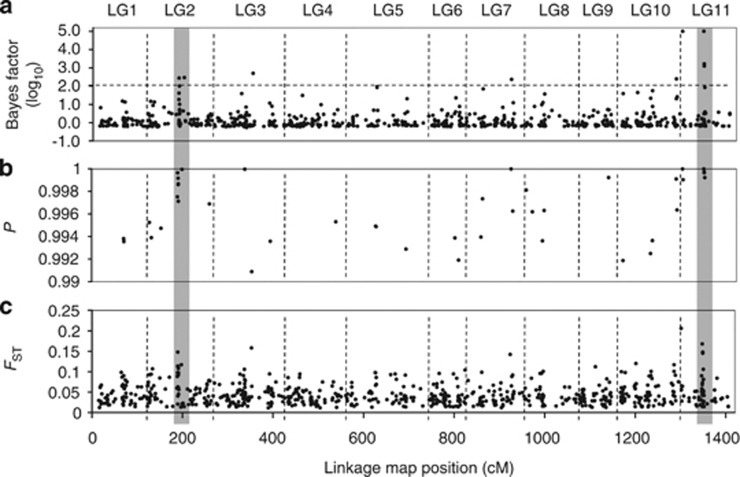
Figure 5.
The distribution of markers identified as being potentially involved in local adaptation across the genome of C. japonica. The figure shows plots of marker position (based on 1255 mapped SNPs or the other DNA markers; Moriguchi et al., 2012) in cumulative centiMorgans (cM) versus (a) Bayes factor (log10), as determined by BayeScan analysis, (b) the probability that the locus is an outlier as judged by the FST-based test (Beaumont and Nichols, 1996) and (c) F-statistic value, FST. Vertical dashed lines demarcate the 11 LGs. The two gray zones indicate candidate regions associated with local adaptation.

