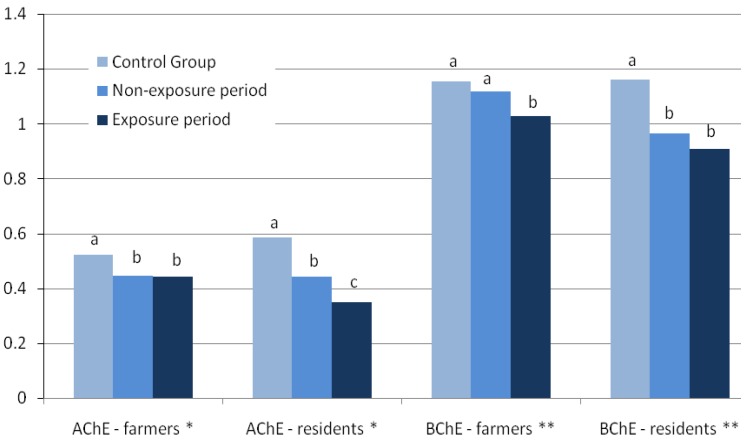
Figure 2.
Mean enzyme activities of the Taquara farmers and resident groups during the non-exposure (n = 64 and 18, respectively) and exposure periods (n = 54 and 17, respectively) compared with their respective controls (n = 41 and 23, respectively). * µmol/min/mg of protein; ** µmol/min/mL of plasma. For each enzyme/group, bars with different letters have statistically different means (p < 0.05).

