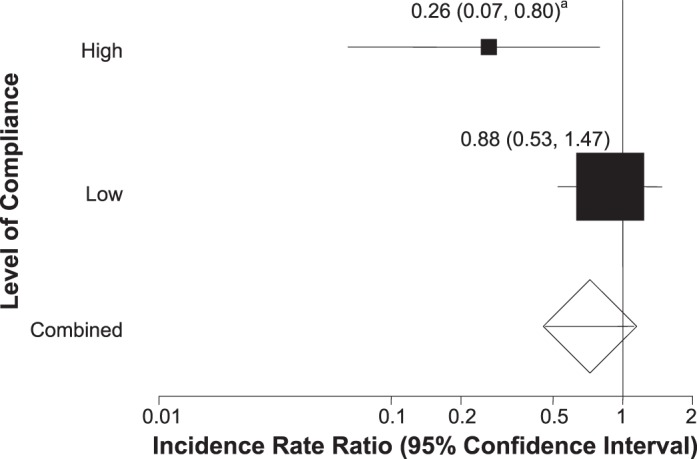
Figure 2.

Incidence rate ratio among studies with high and low compliance rates. a Indicates the incidence rate ratios were lower in studies with high compliance rates than low compliance rates (incidence rate ratio = 0.26, 95% confidence intervals = 0.07, 0.80).
