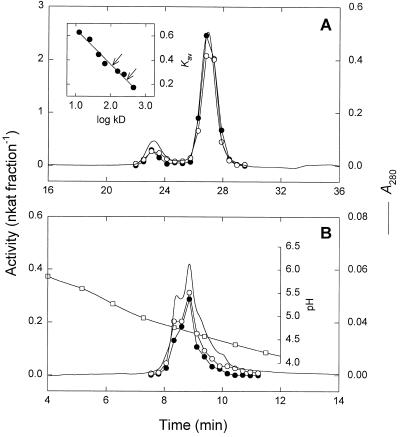
Figure 4.
Size-exclusion chromatography (A) and chromatofocusing (B) of purified STS. STS (•) and GOS (○) activities were determined by HPLC as described in Methods. A, Elution profile from a Superdex 200 HR 10/30 column. Inset, Native molecular mass estimation. The apparent molecular masses of STS (110 and 283 kD) are indicated by arrows. B, Elution profile from a Mono P HR 5/5 column. The pH gradient (□) was formed with Polybuffer 74.

