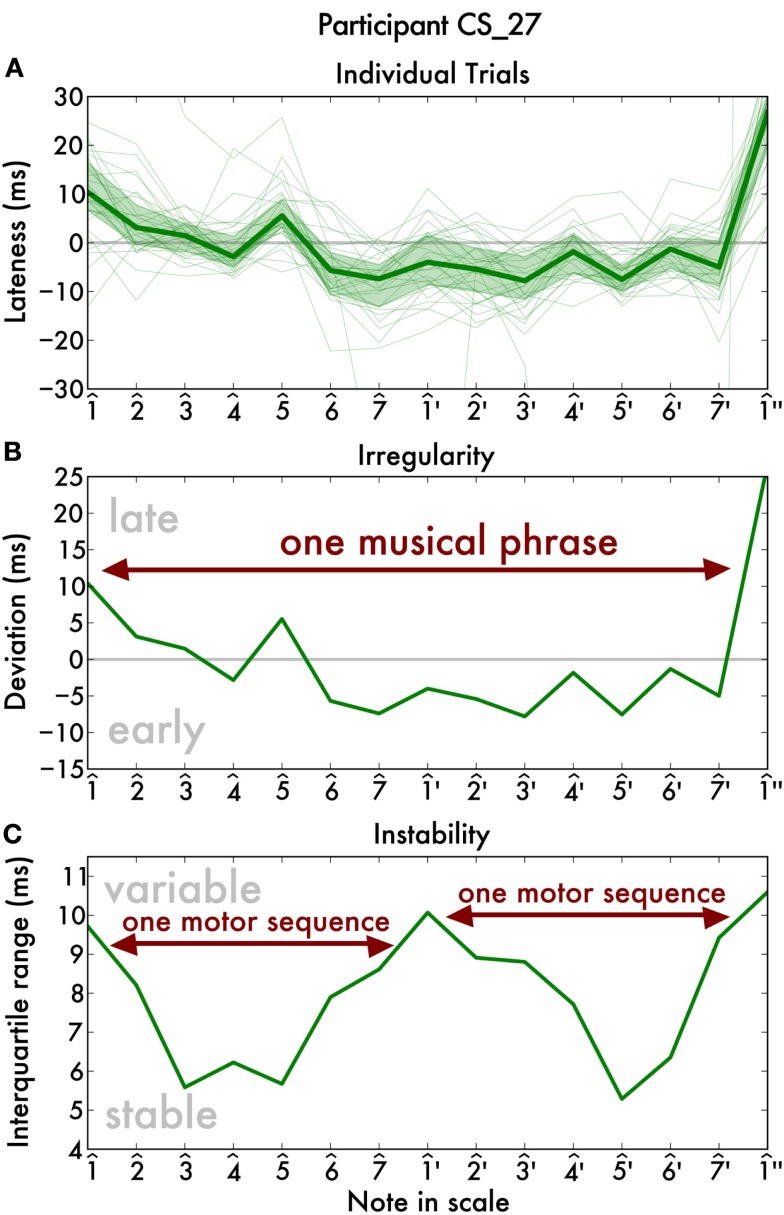
Figure 1.
Overview of our analysis of one pianists’ scale playing reveals that a single musical phrase is divided into at least two motor sequences. (A) For each note, the deviation (in ms) from the straight line that we fit to the key onsets. The thin lines show the deviation profile of one single trial. The thick line shows their median and the shaded area indicates the interquartile range (a measure of variability). These two quantities are then separated to yield two separate traces per pianist: an irregularity trace (B) that shows the average lateness, and an instability trace (C) that shows the average deviation from his or her playing, i.e., the width of the error area in the top plot.

