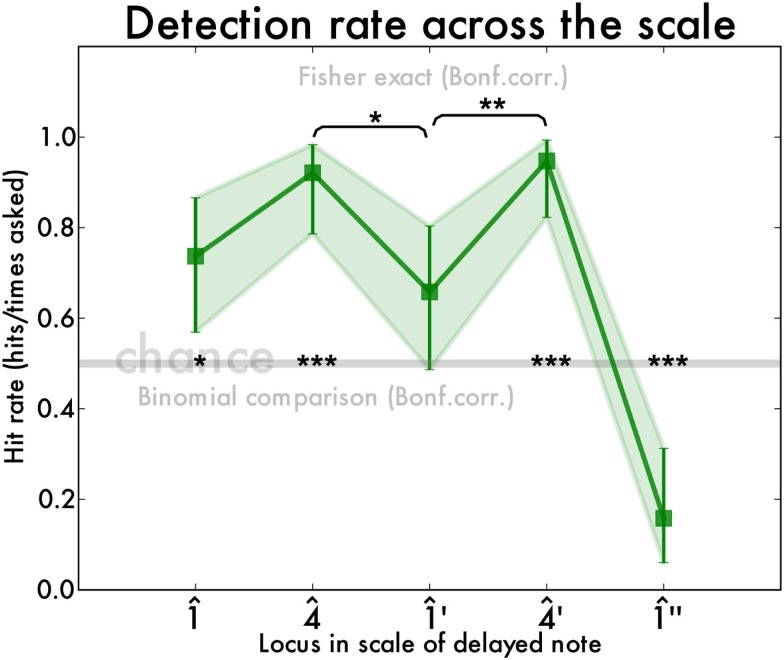
Figure 5.
Hit rate (number of correct answers divided by number of presentations) for detection of timing perturbations at different notes in the two-octave C-major scale. Chance level is at 0.5 and is indicated by a gray line. The shaded area and the error bars demarcate the 95% binomial confidence interval.

