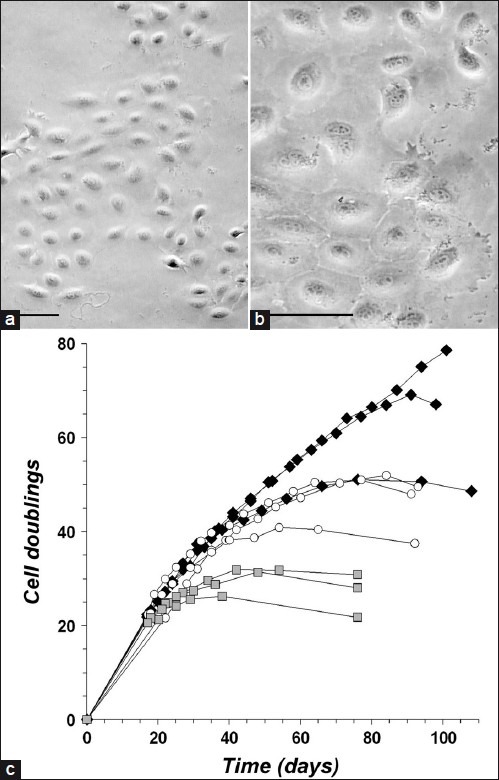
Figure 3.

Proliferative potential of keratinocyte clones (a, b) Lower and higher power views of cloned keratinocytes from ovine vibrissa DP/ GE explants (phase contrast view). Scale bars = 50 μm; (c) Growth time courses of ovine keratinocyte clones through multiple passages. Nine clones were compared, 3 from vibrissa DS/ORS explants (black diamonds), 3 from vibrissa DP/GE explants (white circles), and 3 from wool follicle DP/GE explants (grey squares). Each data point represents a passage, when cells were counted and cumulative cell doublings were calculated.Proliferation was considered to have ceased when each growth curve reached a plateau or began to decline. At these times, the rate of production of new cells had become less than the rate of cell death
