Figure 4.

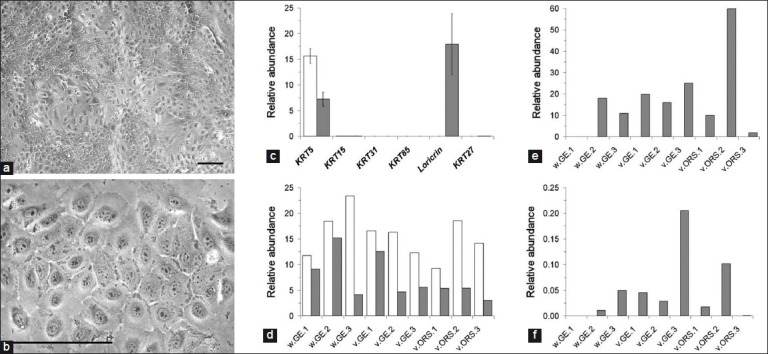
Differentiation of keratinocytes (a, b) Lower and higher power views of differentiating keratinocytes from ovine vibrissa DP/GE explants (phase contrast view). Patches of more and less advanced differentiation can be seen. More differentiated cells appear with a grainy, slightly darker cytoplasm and a less distinct nucleus.Scale bars = 100 μm; (c-f) Quantitative PCR analysis of marker gene expression.The same 9 clones as described in Figure 3 were compared, 3 from wool follicle DP/GE explants (w.GE), 3 from vibrissa DP/GE explants (v.GE), and 3 from vibrissa DS/ORS explants (v.ORS). For each clone, expression was compared in undifferentiated, subconfluent cells (white bars) and differentiated, confluent cells (grey bars); (c) The mean, normalized expression value across all nine clones was plotted for each marker gene and differentiation state.The most abundantly expressed genes were KRT5 in both undifferentiated and differentiated cells and loricrin in differentiated cells only; (d) The normalized expression levels of KRT5 were plotted separately for each clone and differentiation state; (e, f) Normalized expression levels of loricrin and KRT27, respectively, for each clone and differentiation state.Overall, expression levels varied between clones, but there were no consistent differences between tissues of origin
