Abstract
We demonstrate a novel approach for the real time visualization and quantification of the 3D spatial frequencies in an image domain. Our approach is based on the spectral encoding of spatial frequency principle and permits the formation of an image as a color map in which spatially separated spectral wavelengths correspond to the dominant 3D spatial frequencies of the object. We demonstrate that our approach can visualize and analyze the dominant axial internal structure for each image point in real time and with nanoscale sensitivity to structural changes. Computer modeling and experimental results of instantaneous color visualization and quantification of 3D structures of a model system and biological samples are presented.
OCIS codes: (180.6900) Three-dimensional microscopy, (070.6110) Spatial filtering, (070.4790) Spectrum analysis, (290.1350) Backscattering, (050.6624) Subwavelength structures
1. Introduction
Microscopic imaging and accurate nanoscale quantification of the internal structures of an unlabeled three-dimensional (3D) object are of great importance to many fields, such as biology, medicine, materials science, and nanotechnology. The classical approach of reconstructing the 3D structure of an object is based on the collection of all the Fourier components of its 3D Fourier spectrum, followed by reconstruction of the scattering potential of the object [1–3]. Various methods have been developed to collect all accessible spatial frequencies, including changing the angular and spectral properties of the illumination wave [4–10]. Other methods to quantify structural information without reconstruction of the scattering potential include imaging light-scattering spectroscopy that utilizes spectral or angular elastic scattering dependences [11–18] and direct analysis of the Fourier spectrum of the object [19, 20]; methods based on the direct analysis of the Fourier spectrum [20] have been reported to provide less than 10 nm sensitivity to structural changes of 2D periodic objects.
Despite these advances, current techniques do not support real-time probing of 3D structures, especially at the nanoscale, due to limited resolution, accuracy, and sensitivity, especially in the axial direction. The real-time characterization of the sub-surface, internal structure of a 3D object in the axial direction at the nanoscale level remains a significant challenge.
Most of imaging microscopy techniques use an intensity-based contrast mechanism in which object parameters (absorption, scattering, optical density, birefringence, etc) are converted into an intensity distribution. It is known, however, that human eye can generally differentiate the variation in colors better than grayscale levels [21]. About 10 million colors can be distinguished by the human eye [22]. The advantages of color imaging were realized many years ago. Attempts to introduce pseudocolors to encode different parameters were published [23–26]. In all of these methods, colors in the image were produced by either color filters or dispersion elements (diffraction gratings or spectral prism).
A novel imaging principle, spectral encoding of the spatial frequency principle, exploits the advantages of color imaging while achieving super-resolution [27]. This approach is based on encoding each local spatial frequency component of an object with a corresponding optical wavelength (or spectral color in the image). An important aspect of this approach is that the bandwidth of the transmitted spatial frequency from an object does not depend on the numerical aperture (NA) of the optical system. As a result, a wide bandwidth of spatial frequencies can be simultaneously passed through a low-NA optical system, allowing the observation of finer details that may not be resolved using conventional microscopy. Based on this principle, we recently developed a new technique, spectral contrast imaging microscopy (SCIM), for real-time, super-resolution imaging [28]. We showed the ability of SCIM to resolve 2D microscopic objects separated at a distance smaller than the diffraction-limited resolution of the optical system with superior image contrast.
In this paper, we exploit the ability of the spectral encoding of spatial frequency (SESF) principle for real-time quatification of axial structures at the nanoscale. Colors in real-time (Rt) SESF images are produced neither by the consumption of light energy (a well-known imaging contrast mechanisms such as absorption and emission), nor by using additional dispersion elements (diffraction gratings or prisms) or color filters [23–26]. Instead these images are produced by the structure of the object itself. Rather than a traditional intensity-based image, a wavelength-based color map of dominant axial structure is formed with a single snapshot image acquisition. Although such an image does not achieve nanoscale spatial resolution, it quantifies the structural information of an object with nanoscale sensitivity and its accuracy is well beyond the resolution limit of conventional microscopy. We provide a brief theoretical presentation of our approach and demonstrate using model systems and biological samples the ability of SESF to achieve real-time quantitative structural imaging and characterization of 3D objects.
2. Theory
2.1 Translation of the 3D spatial frequency onto the image plane
In general the 3D structure of an object can be described using 3D scattering potential, or its Fourier transform [1, 2]. When a plane wave with a wide spectral bandwidth illuminates the object, the spatial frequencies in K-space (i.e. Fourier components of the 3D scattering potential) at a fixed illumination angle , under the Born approximation, can be represented as multiple Ewald’s spheres with different radii (Fig. 1(a) ) [1]. Each Ewald’s sphere corresponds to one specific wavelength and every point on the Ewald’s sphere corresponds to a 3D spatial frequency vector whose components can be derived from the following expressions:
| (1) |
| (2) |
| (3) |
where is the refractive index, is the scattering angle (Fig. 1(a)) and is the azimuthal angle.
Fig. 1.
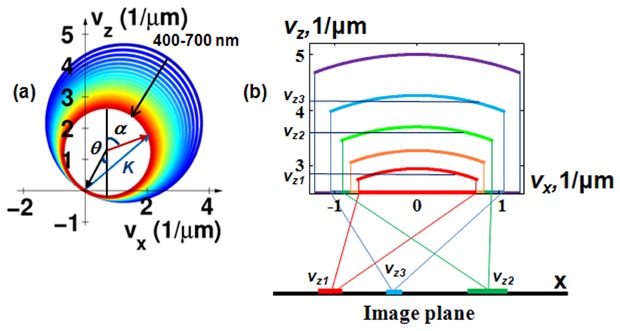
Principle of Rt SESF approach. (a) Representation of the spatial frequencies in (K)-space at tilted illumination; (b) At the normal incidence, the projection of three different spatial frequency ranges, describing three characteristic axial structures, onto the Fourier plane, forming three image areas on the image with three distinct dominant colors.
An optical imaging system generally has restricted access to the spatial frequencies of an object (i.e. Fourier components of the 3D scattering potential), corresponding to caps at the apex of Ewald’s spheres [29]. The information about the accessible 3D spatial frequencies is presented on the Fourier plane as wavelength distribution. The spectral signal at each location can be measured and the 3D scattering potential can be further reconstructed by 3D inverse Fourier transform of the 3D Fourier components of the scattering potential, where integration extends over the accessible range [1]. This also forms the basis of optical diffractive tomography [4]. However, it is a time-consuming process and computationally intensive. Due to the limited accessible bandwidth in the Fourier space (determined by the NA of the optical system) and the integration procedure, such reconstruction significantly reduces the nanoscale structural sensitivity.
The Rt-SESF is essentially a simplified implementation of this concept by 2D inverse Fourier transform of the selected 3D Fourier components using an optical system. To overcome the limited accuracy of the reconstructed scattering potential via the Fourier transform [1–4], the Rt-SESF approach instead directly accesses the 3D spatial frequency, which can be quantified with nanoscale accuracy and sensitivity. Rt-SESF translates the structural information (3D spatial frequency), encoded as wavelengths, onto the image plane (Fig. 1(b)). The information about the dominant structure at each image point on the Rt-SESF image is presented as a corresponding spectral color (natural color, rather than pseudocolor), without compromising the sensitivity to nanoscale structural information.
In conventional microscopy the structural information about 3D spatial frequency in the image plane is hidden by the multi-frequency spectral signals from different illumination angles and predominant non-informative zero-order spectral and spatial-frequency signals that contribute to each image point. Therefore, the conventional white-light image usually does not present any structural colors.
In contrast, the Rt-SESF system performs spatial-spectral filtering (i.e., collimated broadband illumination with single spatial frequency for each wavelength, selection of the required spatial-spectral range and suppression of zero-order signal) to encode 3D spatial frequencies of the object with respective wavelengths. The encoded 3D spatial frequencies are passed through the imaging system and the dominant spatial frequency of the structure of the object at each image point is presented as a corresponding dominant wavelength or natural color, which can directly be visualized by human eyes. This colored Rt-SESF image can also be recorded using a color (RGB) camera in real time with a single snapshot.
Furthermore, in the reflection configuration, at normal illumination and within moderate NA (e.g., NA = 0.5) of the imaging system, the curvature in the accessible caps of Ewald’s spheres is small (Fig. 1(b)). Thus the axial spatial frequency vz (or period Hz = 1/vz) at a given wavelength is only weakly dependent on the backscattering angle within a relatively small collection angular range. All scattered light, at different scattering angles within the collection angular range at a given wavelength, carry the information about one particular axial spatial frequency (period) (Fig. 2(a) ). In other words, a given wavelength carries the specific structural information characterized by one particular spatial frequency in the axial direction, independently of the lateral spatial frequency. Thus the axial spatial frequency is spectrally encoded. All scattered light within the collection angular range (all accessible lateral spatial frequency components) contribute to the signal at each image point and correspond to one specific axial spatial frequency at a given wavelength, thus establishing a one-to-one correspondence between wavelength and axial spatial frequency at each image point. As also suggested in Fig. 2(b), the axial projection of the spatial frequency has much stronger dependence on the wavelength, than the lateral projection. As a result, the structural information (in the axial direction) at each image point, quantified by the axial spatial frequencies, can then be visualized and quantified in the image as a specific combination of these wavelengths, or the corresponding natural color (Fig. 1(b)). Therefore, for a moderate NA in the reflection configuration, the dominant axial spatial frequency of a 3D structure for each image point can be accessed directly from the image plane (potentially with nanoscale accuracy, as shown below), without explicitly locating its corresponding scattering angle (lateral spatial frequency) in the Fourier plane.
Fig. 2.
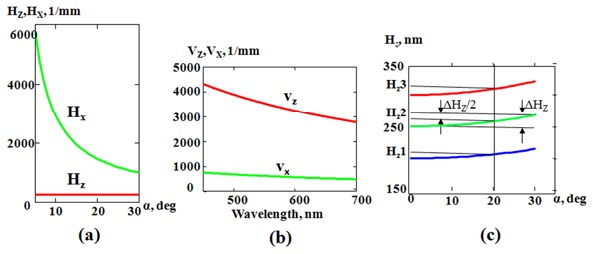
In the reflection configuration, (a) the dependence of axial (red) and lateral (green) spatial periods on the backscattering angle (α) at the given wavelength of 500 nm; (b) the dependence of axial (red) and lateral (green) spatial frequency on the wavelength (α = 15⁰); and (c) the dependence of axial spatial periods on the backscattering angle, which shows the uncertainty in quantification of the axial spatial periods within a moderate collection angle of 30⁰. ΔHz is defined as the maximum theoretical uncertainty.
2.2 Quantitative estimation of the 3D spatial frequency
The quantitative information about axial structure can be obtained by determining of the dominant wavelength at each image point and calculated using Eq. (3). The accuracy is described by the maximal uncertainty for determining the axial spatial period at a normal incidence angle, which can be estimated using Eq. (4):
| (4) |
where is the collected backscattering angle. For example, for a system with NA = 0.5 (lateral resolution is 0.7 microns), , for = 540 nm, = 1, the maximum theoretical uncertainty in determining axial spatial period is about 20 nm, and the estimated theoretical error is ± 10 nm for NA = 0.5 ( = 20° is used to calculate the estimated theoretical error to get mid-value of this error with a symmetrical distribution, as shown in Fig. 2(c)). Thus such an approximation provides a simple means to determine the dominant spatial period of 3D structure in the axial direction for each image point via direct analysis of the wavelength distribution in the image plane.
In the Rt-SESF system, the true-color of the spectrally encoded image is recorded in the RGB color space using a color CCD sensor. These RGB color space pixel data are transformed to the device independent of the CIE XYZ color space [30], where the chromatic coordinates of the pixel color are associated with the closest dominant wavelength on the curved spectral locus. We have employed this method to quantify SCIM images [28]. A similar approach has also been used by Clancy et al. [31].
The Xrite mini color checker was used to compute the matrix that defines the linear transform between the RGB color space of the sensor and the CIE XYZ color space. The required measurements along with the sensor noise, however, can potentially introduce deviations in our dominant wavelength calculation. To reduce this potential source of error we computed the wavelength corresponding to three MaxLine laser clean-up filters (Semrock) with precisely defined laser lines (442 nm, 543 nm, and 633 nm) covering the optical range of interest. Based on these measurements we computed a quadratic polynomial regression curve to correct for errors. We determined that the errors in our dominant wavelength calculation have an upper bound of 17 nm, which is referred to as estimated spectral resolution.
The sensitivity to structural changes can be estimated using next expression:
| (5) |
where is the minimum wavelength change that can be determined and is the corresponding sensitivity in the axial spatial period. Because the CIE XYZ color space-based method quantifies the dominant wavelengths in the Rt-SESF at an estimated spectral resolution of nm, for NA = 0.5, , = 540 nm, = 1, the structural sensitivity in the axial direction is about nm.
These theoretical estimations demonstrate that the quantitative characterization of axial structure using our Rt-SESF approach can be performed with nanoscale accuracy and sensitivity. These data also show (Fig. 2(c)) that for low-NA imaging system (large field-of-view imaging), our approach provides even better accuracy for characterization of the axial structure.
3. Computer modeling
Next, we performed a proof-of-concept demonstration using a numerically constructed 3D object of 20 by 20 by 20 μm using a 3D grid at a lateral spatial resolution of 250 nm and an axial spatial resolution of 50 nm. The 3D object was sub-divided into a 2 by 2 lateral square block, with each square block having a different dominant axial spatial structure (Fig. 3(a) ). The dominant axial structure in each of the four blocks has a well-defined periodicity in the axial direction with a spatial period of 200 nm, 250 nm, 300nm, and 350 nm, respectively. For each block, a Gaussian stochastic process with randomly chosen correlation lengths ranging from 250 nm to 1 μm was superimposed onto each of the dominant spatial structures as a secondary structure added at each point to increase the complexity of our 3-D object. Such 3D model bears a certain level of complexity, as often present in biological samples. The energy in both the dominant and secondary structures was normalized to one, giving us a consistent signal-to-noise ratio, to ensure that the simulated spectral response was only a function of structure, not the scattering intensity. Figure 3(a) shows the two representative spatial profiles of the axial structures for different regions of the object.
Fig. 3.
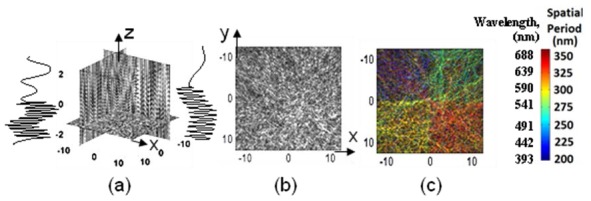
Numerical modeling: (a) representative slices and spatial profiles of the axial structures of the 3D object, (b) bright-field image, (c) Rt-SESF image. Color bar shows the wavelength and the corresponding spatial period of axial structures.
In the numerical simulation, light from a broadband source illuminates the object and the backscattered light within the collection NA of the imaging system (NA = 0.5, the same NA as that used in the experiment) is collected and spectrally encoded, as described above in Section 2.1, to provide one-to-one correspondence between spatial frequency and wavelength. These spatial frequencies correspond to spectral wavelength of 400 nm, 500 nm, 600 nm, and 700 nm, respectively. Consequently, as shown in Rt-SESF image (Fig. 3(c)), the four dominant axial spatial structures are respectively encoded by the four distinct spectral colors on the image plane. In contrast, in the conventional bright-field image without spectral encoding, shown in Fig. 3(b), the four areas with different axial structures cannot be easily distinguished. Quantitative estimation of the spatial period of the dominant axial structure is also presented in the colorbar of Fig. 3(c), based on the color-vision algorithm (Section 2.2) and Eq. (3). It should be noted that a small difference of only 50 nm in the axial spatial period exhibits a distinct spectral color difference in the Rt-SESF image, indicating its nanoscale sensitivity. This result also suggests that in the reflection configuration within a modest NA, the spectral color from a 3D object is mainly affected by the variation in axial spatial frequency, rather than in lateral spatial frequency, consistent with our theoretical prediction (Section 2.1).
4. Experimental setup
The schematic of our Rt-SESF system is shown in Fig. 4 . We used a reflection configuration at normal illumination. Parallel white-light wave (Xenon lamp 150W, Oriel), collected by the objective lens with an NA of 0.5, was filtered in the Fourier plane (FP) to provide the required bandwidth of spatial frequencies and spectral range (the details of the Fourier filter are described in Section 5.1 and 5.2). The Rt-SESF images, Fourier plane images and bright-field images were recorded using color CCD cameras (AxioCam HRc) based on a commercial microscope AXIO Observer Z1 (Carl Zeiss). The specific color at each point of the recorded color images provides information about corresponding dominant spatial frequency (period) of the structure of an object at a given location. The color image in the Fourier-plane allows us to visualize the dependence of spectral colors on the lateral spatial frequency, while the color image in the image-plane provides the color-encoded information about spatial frequency from each image pixel. The color images were processed to convert color distribution into the dominant wavelength distributions and then into the dominant spatial periods distributions, as described in Section 2.2.
Fig. 4.
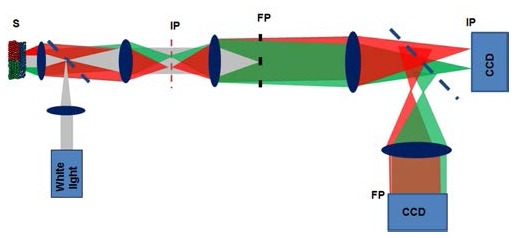
Schematic of the Rt-SESF system. S: sample; IP: image plane; FP: Fourier plane.
5. Experiments and results
5.1 Quantitative visualization of the lateral structure of 2D object
We next demonstrate the principle of Rt-SESF quantitative structural imaging using a thin 2D object, a high-resolution (HR) US Air Force (USAF) target. Given that this is a 2D object with vz = 0, the scattering vector K is in vx—vy plane (Fig. 1(a)). Figures 5(a) -5(b) present the conventional bright-field images of the HR USAF target with a magnified portion of group 8 shown in Fig. 5(c). In the case of a 2D object, the off-axis pinhole-like spatial Fourier filterwas selected to capture the whole range of spatial frequencies of group 8 (spatial frequencies of the elements are 287, 323, 362, 406 and 456 1/mm) in a given direction, encoded as the visible range of wavelengths [25, 26]. The different spectral colors, presented on the Rt-SESF images, quantitatively describe the spatial frequencies of the microstructure with the horizontal (Fig. 5(d)) and the vertical (Fig. 5(e)) orientations for each element. The descriptive color on the Rt-SESF image was then converted into its corresponding dominant wavelength, based on the color vision algorithm (Section 2.2). The spatial frequencies of the 2D structure for each element can be calculated using Eqs. (1-2). The results, shown in the colorbar of Fig. 5, are in good agreement with the manufacturer’s specification. Such structural information cannot be quantified from the conventional image that is formed using the optics with the same resolution.
Fig. 5.

Bright-field (a) high resolution (NA = 0.5) and (b) low resolution (NA = 0.06) images of the HR USAF target; (d), (e) Rt-SESF images (NA = 0.06) of the selected area (c) in the image (b). Colorbar shows the dominant wavelength and corresponfing spatial frequency.
5.2 Quantitative visualization of the axial structure
To experimentally demonstrate the ability of our Rt-SESF approach to probe with nanoscale sensitivity the axial structure of a complex 3D object we used multilayer nanosphere aggregates consisting of nanospheres of known sizes (Thermo Fisher Scientific) 125 ± 3 nm, σ = 4.5 nm; 147 ± 3 nm, σ = 4.3 nm; 203 ± 5 nm, σ = 4.7 nm; 240 ± 5 nm, σ = 3.7 nm according to manufacturer’s specification, where σ is a standard deviation. An aliquot of about 10 of diluted monodispersed polystyrene nanosphere suspension (n = 1.59) was smeared uniformly onto a glass slide and dried, forming nanosphere aggregates (Figs. 6(a) -6(b)) [32, 33]. The optical thickness of the nanosphere aggregate, measured using an interferometry setup [34], was about 30 microns, suggesting a multi-layer structure. Such a multilayer nanosphere aggregate produces a 3D quasi-periodic structure in which the spatial periods depend on nanosphere size and packing, while also introduces some complexity and can serve as a surrogate cell phantom.
Fig. 6.
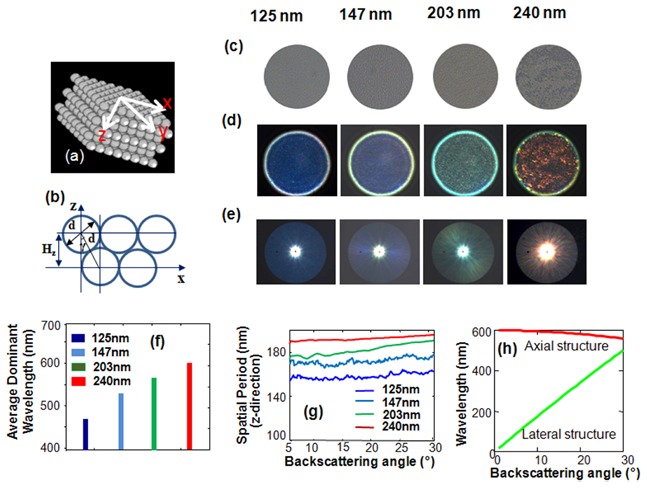
Rt-SESF imaging of 3D structures of the multilayered nanosphere aggregates at four distinct diameters. (a), (b) Illustration of the configuration of the nanosphere aggregates. (c) Conventional bright field images. (d), (e) Rt-SESF images and Fourier plane images respectively. (f) Axial spatial periods for the averaged dominant structure of each sample. (g) Distribution of axial spatial period along the lateral direction in the Fourier plane. (h) The dependence of the wavelength on the backscattering angle for the axial structure (axial spatial frequency 3333 1/mm) and lateral structure (lateral spatial frequency 1000 1/mm).
To collect the spectral signals for all accessible scattering and azimuthal angles simultaneously, the annular-shaped Fourier mask was implemented as a Fourier filter. The annular Fourier mask suppresses the zero-order signal and removes the contribution of zero-order broadband spectrum from each image point, to provide spectral encoding of the axial spatial frequency at proper illumination (as described in Section 2.1). On the other hand, the annular Fourier mask also effectively uses the NA of the optical system (reasonably large collection angular range) to form a relatively high resolution image. After such spatial-spectral filtering (described in Section 2.1), a specific color signature is formed for each local structure of the object. The Rt-SESF images were recorded simultaneously along with the images in the Fourier plane (FP) using the optical system shown in Fig. 4. All images were recorded using an objective lens with NA = 0.5.
Figure 6 shows conventional bright-field (Fig. 6(c)) and corresponding Rt-SESF images (Fig. 6(d)) of nanosphere aggregates. The nanospheres, whose sizes (and lateral spatial periods) are well beyond the lateral resolution limit of our optical system, are indistinguishable in the conventional images (Fig. 6(c)). No spatial information about such a lateral structure can be passed through the optical system, but such structural information in the axial direction can be passed through the optical system using SESF, as suggested in Figs. 2(a)-2(b). The nanoscale size differences are clearly presented as distinct colors in the Rt-SESF images (Fig. 6(d)) and in the Fourier-plane images (Fig. 6(e)). The Fourier-plane images in Fig. 6(e) clearly show the projections of different caps of Ewald’s spheres (Fig. 1) which correspond to different wavelengths (and different axial spatial frequencies (periods)). The dominant colors in each Rt-SESF image and in the corresponding Fourier plane are directly correlated with the dominant spatial frequency of the axial structure, which depends on the nanosphere size. As the size of nanospheres increases, the corresponding axial spatial frequency decreases and the Rt-SESF image exhibits a progressively red-shifted color as predicted by Eq. (3). The average values of the calculated dominant wavelengths, shown in Fig. 6(f) also show a progressive increase. One can see that even a 25 nm difference in nanosphere size can be easily distinguished by the spectral color shift.
The distribution of the calculated dominant axial spatial periods in the Fourier plane images (Fig. 6(e)) is presented in Fig. 6(g). Figures 6(e) and 6(g) also confirm our previous theoretical prediction (shown in Eq. (3) and Fig. 2(a)) that the axial spatial frequency has a weak dependence on the on backscattering angle (i.e., lateral coordinates in the Fourier plane). The distinct colors shown in Fig. 6(e) also confirm that they correspond to the axial projection of the dominant spatial frequency, rather than the lateral spatial frequency. Even if the lateral spatial frequency would be small enough to be passed through the optical system, to form such a Fourier-plane image with a distinct color as shown in Fig. 6(e), the lateral structures must select the light with the same wavelength for all diffraction angles and suppress the light with all other wavelengths within the broad spectral range of the illumination light, which is not possible. As suggested by Fig. 6(h), the lateral structure cannot form such uniform color distribution in the Fourier plane. Thus the colors in the Rt-SESF images (Fig. 6(d)) indeed represent the axial structure.
Further, it should be noted that the calculated value of the dominant spatial period is essentially the spatial period in the axial direction, not the size of the nanosphere. As the nanosphere aggregate is formed by self-assembling process [32, 33], the axial spatial period is approximately relative to diameter d of nanospheres as , where γ changes from 0 to 30⁰ (Fig. 6(b)), depending on the packing configuration of nanosphere aggregates (proportional to nanosphere size). The measured axial periods for larger nanospheres (203 nm and 200 nm) in Fig. 6(g) are in a good agreement with our theoretical prediction for γ = 30⁰ (corresponding to 176 nm and 208 nm). For smaller nanospheres (125 nm and 147 nm), the measured periods are larger than the theoretical values, suggesting a possible gap between different layers of the nanosphere aggregate.
5.3 Quantitative characterization of the axial structure of cervical cells
To evaluate the ability of Rt-SESF to detect structural changes in pre-cancerous cells, we analyzed the cervical cytology specimens from 9 patients diagnosed with negative intraepithelial lesion or malignancy (NILM, normal group) and 9 patients diagnosed with high-grade squamous intraepithelial lesion (HSIL, high-grade pre-cancerous group). Figure 7 shows the conventional bright-field (Figs. 7(a) and 7(c)) and the corresponding Rt-SESF images (Fig. 7(b) and 7(d)) for the unstained normal squamous cells from a patient with NILM (Fig. 7(a-b)) and the high-grade precancerous cells labeled as HSIL from a patient with a HSIL cytology diagnosis (Figs. 7(c)-7(d)) made by the expert pathologist.
Fig. 7.
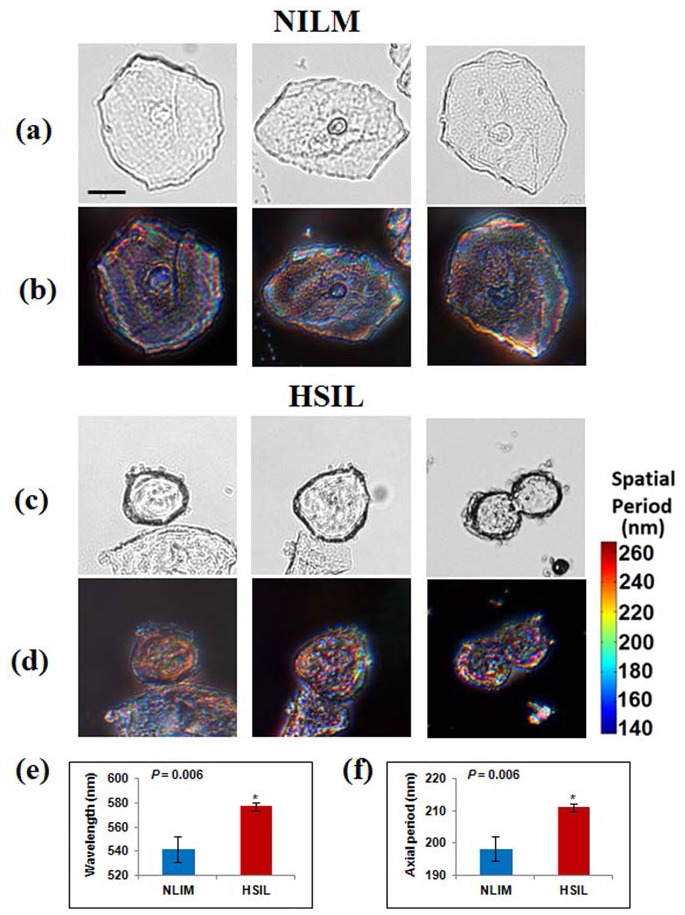
Bright-field (a), (c) and Rt-SESF (in the image plane) (b), (d) images of normal cells from a patient with negative for intra-epithelial lesions or malignancies (NILM) and high-grade squamous intra-epithelial lesions (HSIL) cells; (e) dominant wavelengths and (f) sizes of the dominant axial structure (Hz) within the cell nuclei, derived from the statistical analysis of nine patients with NILM and nine patients with HSIL. Error bars represent the standard error of mean. Scale bar is 10 microns for Figs (a)-(d).
Although the conventional images show the size difference of cell nuclei, they do not clearly reveal the sub-cellular internal structures. However, the Rt-SESF images exhibit distinct differences in colors (wavelengths). For patients with high-grade precancerous cells, the colors within the cell nuclei are clearly red-shifted in Rt-SESF images (Fig. 7(d)), compared with those from normal cells (Fig. 7(b)). This color shift suggests an increased spatial period in the axial intra-nuclear structure of the precancerous cells. The dominant axial structure within the nuclei is further quantified as the axial spatial period (Hz), using the average refractive index of 1.39 [35], and is presented in the colorbar. To confirm that such a structural change is also statistically significant, we analyzed a total of 18 patients (9 patients with NILM and 9 patients with HSIL). For each patient, we evaluated 10-20 cells and took the average value of the dominant wavelengths and their corresponding average dominant axial spatial periods as a representative value for the patient. We then performed Student’s t-test (Microsoft Excel 2007) to obtain two-sided P values (assuming unequal variances). As shown in Fig. 7(e) and 7(f), both the average dominant wavelength and the corresponding axial spatial period show statistically significant differences between NILM and HSIL (P = 0.006). Figures 7(e)-7(f) suggest that the internal structures of the high-grade pre-cancerous cell nuclei exhibit an increased size in the dominant axial structure compared with those in normal cells from the NILM patients. These findings demonstrate the potential of Rt-SESF to detect the subtle structural changes in pre-cancerous cells that are not visible using conventional microscopy.
6. Summary
We introduce a novel approach, spectral encoding of spatial frequency (Rt-SESF) for real-time imaging and quantitative characterization of the internal structure of a 3D object with nanoscale sensitivity. The axial spatial frequency (or periods) of the dominant structure are presented as a 2D color map, which can be captured in real time, with a single snapshot using a color CCD camera. Our theoretical analysis demonstrates that quantitative estimation of the dominant axial structure can be obtained with nanoscale accuracy and sensitivity, by measuring the dominant wavelength at a given location of the Rt-SESF image. We have verified our approach, at nanoscale sensitivity, with both computer modeling and experiments using a model system of nanosphere aggregates. We also demonstrate the ability of Rt-SESF to detect the subtle internal structural changes within the nuclei of pre-cancerous cervical cells, that cannot be seen using conventional microscopy. Potential applications of our technique can be very broad, from clinical cancer detection and basic biomedical research, to nanotechnology and material science, and from microscopic to macroscopic imaging.
We acknowledge the funding support from National Cancer Institute ( R21CA152935, YL). We thank Michelle Kienholz for editing the manuscript.
References and links
- 1.M. Born and E. Wolf, Principles of Optics: Electromagnetic Theory of Propagation, Interference and Diffraction of Light (Cambridge University Press, Cambridge; New York, 1999). [Google Scholar]
- 2.Wolf E., “Three dimensional structure determination of semi-transparent objects from holographic data,” Opt. Commun. 1(4), 153–156 (1969). 10.1016/0030-4018(69)90052-2 [DOI] [Google Scholar]
- 3.Kukulin V. I., Pomerantsev V. N., Horácek J., “Reconstruction of the potential from scattering data,” Phys. Rev. A 42(5), 2719–2727 (1990). 10.1103/PhysRevA.42.2719 [DOI] [PubMed] [Google Scholar]
- 4.Haeberle O., Belkebir K., Giovaninni H., Sentenac A., “Tomographic diffractive microscopy: basics, techniques and perspectives,” J. Mod. Opt. 57(9), 686–699 (2010). 10.1080/09500340.2010.493622 [DOI] [Google Scholar]
- 5.Alexandrov S. A., Hillman T. R., Gutzler T., Sampson D. D., “Synthetic aperture fourier holographic optical microscopy,” Phys. Rev. Lett. 97(16), 168102 (2006). 10.1103/PhysRevLett.97.168102 [DOI] [PubMed] [Google Scholar]
- 6.Hillman T. R., Gutzler T., Alexandrov S. A., Sampson D. D., “High-resolution, wide-field object reconstruction with synthetic aperture Fourier holographic optical microscopy,” Opt. Express 17(10), 7873–7892 (2009). 10.1364/OE.17.007873 [DOI] [PubMed] [Google Scholar]
- 7.Micó V., Zalevsky Z., Ferreira C., García J., “Superresolution digital holographic microscopy for three-dimensional samples,” Opt. Express 16(23), 19260–19270 (2008). 10.1364/OE.16.019260 [DOI] [PubMed] [Google Scholar]
- 8.Kim M. K., “Tomographic three-dimensional imaging of a biological specimen using wavelength-scanning digital interference holography,” Opt. Express 7(9), 305–310 (2000). 10.1364/OE.7.000305 [DOI] [PubMed] [Google Scholar]
- 9.Kühn J., Montfort F., Colomb T., Rappaz B., Moratal C., Pavillon N., Marquet P., Depeursinge C., “Submicrometer tomography of cells by multiple-wavelength digital holographic microscopy in reflection,” Opt. Lett. 34(5), 653–655 (2009). 10.1364/OL.34.000653 [DOI] [PubMed] [Google Scholar]
- 10.Debailleul M., Georges V., Simon B., Morin R., Haeberlé O., “High-resolution three-dimensional tomographic diffractive microscopy of transparent inorganic and biological samples,” Opt. Lett. 34(1), 79–81 (2009). 10.1364/OL.34.000079 [DOI] [PubMed] [Google Scholar]
- 11.Backman V., Wallace M. B., Perelman L. T., Arendt J. T., Gurjar R., Müller M. G., Zhang Q., Zonios G., Kline E., McGilligan J. A., Shapshay S., Valdez T., Badizadegan K., Crawford J. M., Fitzmaurice M., Kabani S., Levin H. S., Seiler M., Dasari R. R., Itzkan I., Van Dam J., Feld M. S., “Detection of preinvasive cancer cells,” Nature 406(6791), 35–36 (2000). 10.1038/35017638 [DOI] [PubMed] [Google Scholar]
- 12.Alexandrov S. A., Hillman T. R., Sampson D. D., “Spatially resolved Fourier holographic light scattering angular spectroscopy,” Opt. Lett. 30(24), 3305–3307 (2005). 10.1364/OL.30.003305 [DOI] [PubMed] [Google Scholar]
- 13.Hillman T. R., Alexandrov S. A., Gutzler T., Sampson D. D., “Microscopic particle discrimination using spatially-resolved Fourier-holographic light scattering angular spectroscopy,” Opt. Express 14(23), 11088–11102 (2006). 10.1364/OE.14.011088 [DOI] [PubMed] [Google Scholar]
- 14.Liu Y., Li X., Kim Y. L., Backman V., “Elastic backscattering spectroscopic microscopy,” Opt. Lett. 30(18), 2445–2447 (2005). 10.1364/OL.30.002445 [DOI] [PubMed] [Google Scholar]
- 15.Perelman L. T., Backman V., Wallace M., Zonios G., Manoharan R., Nusrat A., Shields S., Seiler M., Lima C., Hamano T., Itzkan I., Van Dam J., Crawford J. M., Feld M. S., “Observation of periodic fine structure in reflectance from biological tissue: A new technique for measuring nuclear size distribution,” Phys. Rev. Lett. 80(3), 627–630 (1998). 10.1103/PhysRevLett.80.627 [DOI] [Google Scholar]
- 16.Chalut K. J., Ostrander J. H., Giacomelli M. G., Wax A., “Light scattering measurements of subcellular structure provide noninvasive early detection of chemotherapy-induced apoptosis,” Cancer Res. 69(3), 1199–1204 (2009). 10.1158/0008-5472.CAN-08-3079 [DOI] [PMC free article] [PubMed] [Google Scholar]
- 17.Wax A., Yang C. H., Izatt J. A., “Fourier-domain low-coherence interferometry for light-scattering spectroscopy,” Opt. Lett. 28(14), 1230–1232 (2003). 10.1364/OL.28.001230 [DOI] [PubMed] [Google Scholar]
- 18.Gutzler T., Hillman T. R., Alexandrov S. A., Sampson D. D., “Three-dimensional depth-resolved and extended-resolution micro-particle characterization by holographic light scattering spectroscopy,” Opt. Express 18(24), 25116–25126 (2010). 10.1364/OE.18.025116 [DOI] [PubMed] [Google Scholar]
- 19.Boustany N. N., Kuo S. C., Thakor N. V., “Optical scatter imaging: subcellular morphometry in situ with Fourier filtering,” Opt. Lett. 26(14), 1063–1065 (2001). 10.1364/OL.26.001063 [DOI] [PubMed] [Google Scholar]
- 20.Pasternack R. M., Qian Z., Zheng J. Y., Metaxas D. N., Boustany N. N., “Highly sensitive size discrimination of sub-micron objects using optical Fourier processing based on two-dimensional Gabor filters,” Opt. Express 17(14), 12001–12012 (2009). 10.1364/OE.17.012001 [DOI] [PubMed] [Google Scholar]
- 21.B. A. R. M. Rangayyan and C. Serrano, Color Image Processing with Biomedical Applications (SPIE Press, Bellingham, Washington, 2011). [Google Scholar]
- 22.D. B. Judd and G. Wyszecki, Color in business, science, and industry (Wiley, New York, 1975). [Google Scholar]
- 23.Holder D. W., North R. J., “A Schlieren apparatus giving an image in colour,” Nature 169(4298), 466 (1952). 10.1038/169466a0 [DOI] [Google Scholar]
- 24.G. S. Settles, Schlieren and Shadowgraph Techniques: Visualizing Phenomena in Transparent Media (Springer, Berlin; New York, 2001). [Google Scholar]
- 25.Bescos J., Strand T. C., “Optical pseudocolor encoding of spatial frequency information,” Appl. Opt. 17(16), 2524–2531 (1978). [DOI] [PubMed] [Google Scholar]
- 26.Yu F. T. S., Zhuang S. L., Chao T. H., Dymek M. S., “Real-time white light spatial frequency and density pseudocolor encoder,” Appl. Opt. 19(17), 2986–2990 (1980). 10.1364/AO.19.002986 [DOI] [PubMed] [Google Scholar]
- 27.Alexandrov S. A., Sampson D. D., “Spatial information transmission beyond a system's diffraction limit using optical spectral encoding of the spatial frequency,” J. Opt. A, Pure Appl. Opt. 10(2), 025304 (2008). 10.1088/1464-4258/10/2/025304 [DOI] [Google Scholar]
- 28.Alexandrov S. A., Uttam S., Bista R. K., Liu Y., “Spectral contrast imaging microscopy,” Opt. Lett. 36(17), 3323–3325 (2011). 10.1364/OL.36.003323 [DOI] [PMC free article] [PubMed] [Google Scholar]
- 29.Kou S. S., Sheppard C. J. R., “Imaging in digital holographic microscopy,” Opt. Express 15(21), 13640–13648 (2007). 10.1364/OE.15.013640 [DOI] [PubMed] [Google Scholar]
- 30.S. K. Shevell, The Science of Color (Elsevier, Amsterdam; Boston, 2003). [Google Scholar]
- 31.Clancy N. T., Stoyanov D., Maier-Hein L., Groch A., Yang G. Z., Elson D. S., “Spectrally encoded fiber-based structured lighting probe for intraoperative 3D imaging,” Biomed. Opt. Express 2(11), 3119–3128 (2011). 10.1364/BOE.2.003119 [DOI] [PMC free article] [PubMed] [Google Scholar]
- 32.Chen K., Taflove A., Kim Y. L., Backman V., “Self-assembled patterns of nanospheres with symmetries from submicrons to centimeters,” Appl. Phys. Lett. 86(3), 033101 (2005). 10.1063/1.1851002 [DOI] [Google Scholar]
- 33.Fu Y. N., Jin Z. G., Liu G. Q., Yin Y. X., “Self-assembly of polystyrene sphere colloidal crystals by in situ solvent evaporation method,” Synth. Met. 159(17-18), 1744–1750 (2009). 10.1016/j.synthmet.2009.05.017 [DOI] [Google Scholar]
- 34.Wang P., Bista R., Bhargava R., Brand R. E., Liu Y., “Spatial-domain low-coherence quantitative phase microscopy for cancer diagnosis,” Opt. Lett. 35(17), 2840–2842 (2010). 10.1364/OL.35.002840 [DOI] [PMC free article] [PubMed] [Google Scholar]
- 35.Drezek R., Guillaud M., Collier T., Boiko I., Malpica A., Macaulay C., Follen M., Richards-Kortum R., “Light scattering from cervical cells throughout neoplastic progression: influence of nuclear morphology, DNA content, and chromatin texture,” J. Biomed. Opt. 8(1), 7–16 (2003). 10.1117/1.1528950 [DOI] [PubMed] [Google Scholar]


