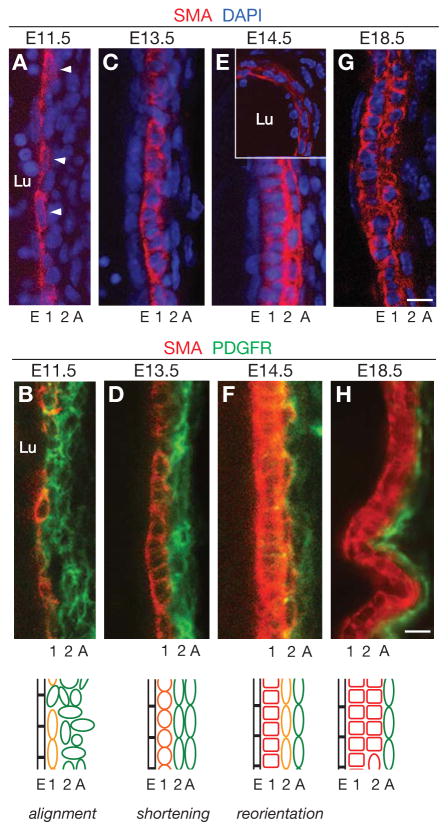
Figure 2. Radial development of the PA wall.
Longitudinal sections through the left PA wall at the embryonic ages indicated, stained for SMA (red), PDGFR-β (green), and nuclei (DAPI, blue) as indicated. Arrowheads, nuclei elongated longitudinally. The inset in E shows a transverse section through the left PA wall. Schematics at bottom summarize SMA (red) and PDGFR-β (green) expression (orange, co-expression of SMA and PDGFR-β) and cell shape and orientation changes in the forming layers (E, 1, 2, A) of the developing PA wall. Lu, PA lumen. Square cells, circumferentially-oriented cells. Scale bars, 10 μm. (See also Fig. S2.)

