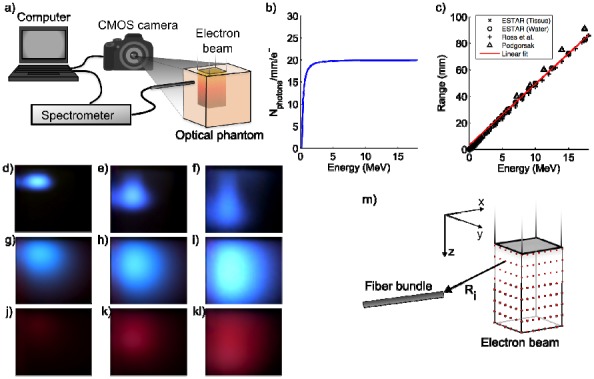
Fig. 1.

Experimental setup. (a) a schematics showing the setup where electron beam irradiates from top of phantom. (b) the Frank-Tamm formula is plotted showing the number of photons generated per mm and electron for varying energy. (c) electron range as a function of energy. (d-f) electron beams at 6, 12 and 18 MeV irradiating a water tank. (g-i) electron beams irradiating a scattering solution of saline and intralipid. (j-l) electron beams irradiating a scattering phantom with added blood. (m) a schematic showing the optical point sources distributed throughout the electron beam.
