Figure 4.
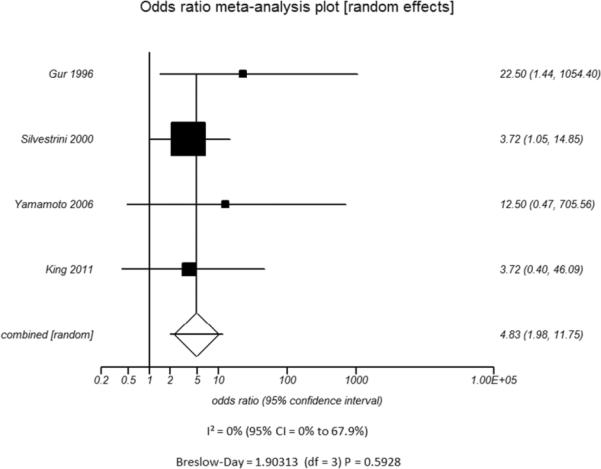
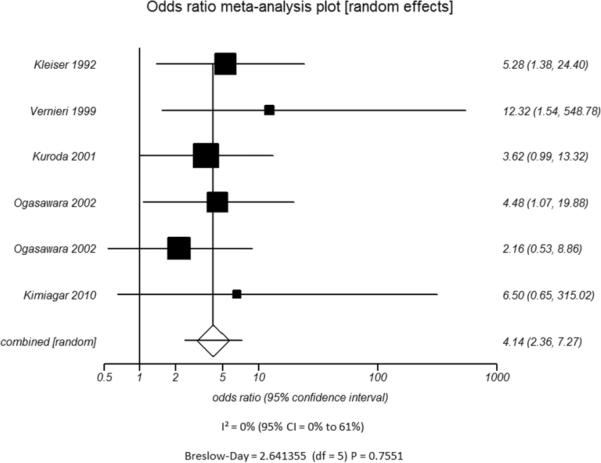
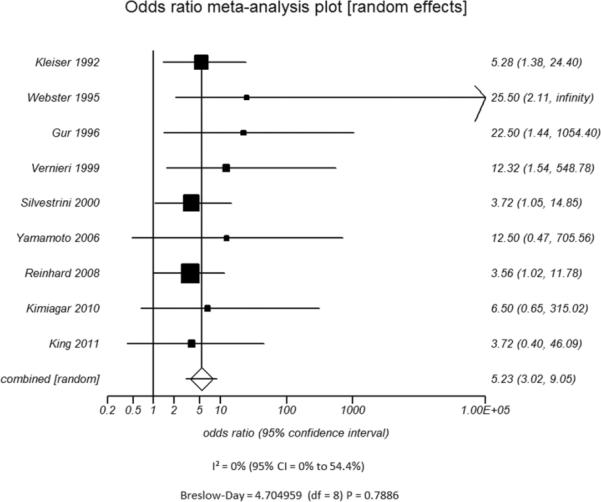
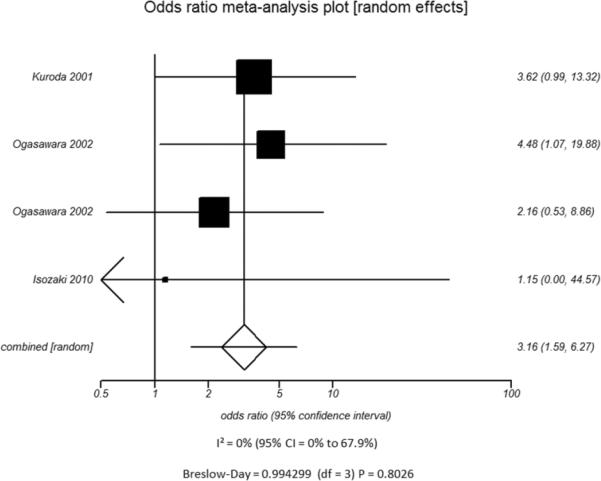
Odds ratio and 95% confidence ratio for studies divided by patient disease characteristics, including studies of patients with only high grade stenosis (A) or only vessel occlusion (B), and patients with disease only in the ICA only (C) or in both the ICA and MCA (D). The symbols and abbreviations are as in Figure 2.
A - High Grade Stenosis
B - Occlusion
C - ICA disease only
D - ICA and MCA mixed populations
A.

B.

C.

D.

